
Century 21 People’s Choice Realty Inc., Brokerage
120 MATHESON BLVD E #103
MISSISSAUGA, Ontario
L4Z 1X1


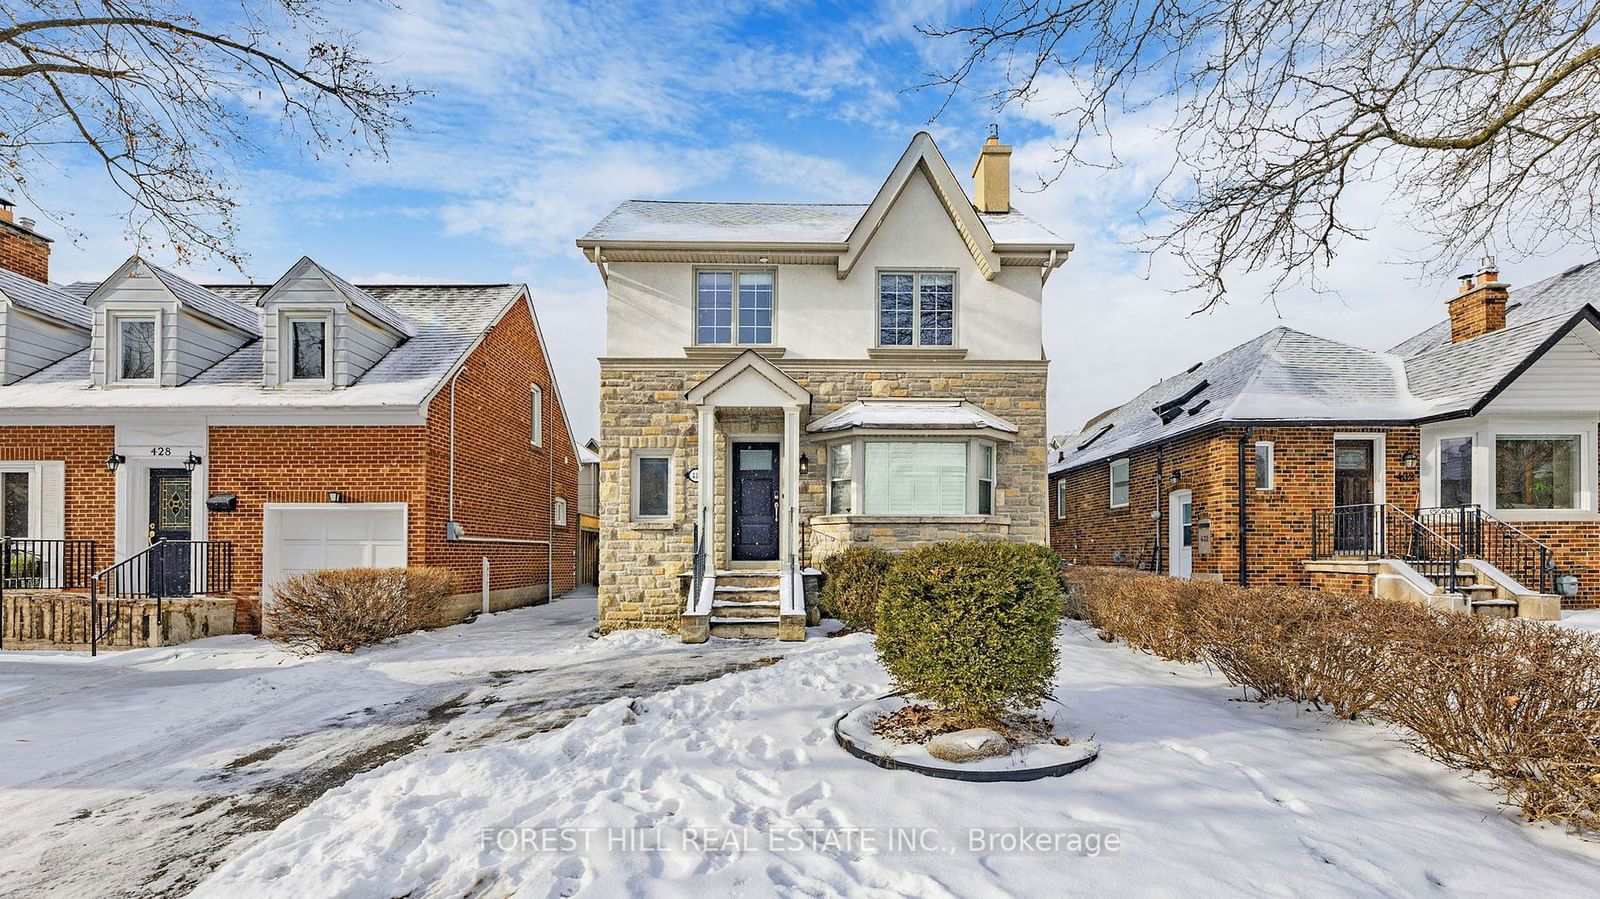
Toronto, Lansing-Westgate, M2N 1B6
$2,475,000
Listed by RE/MAX REALTRON REALTY INC..
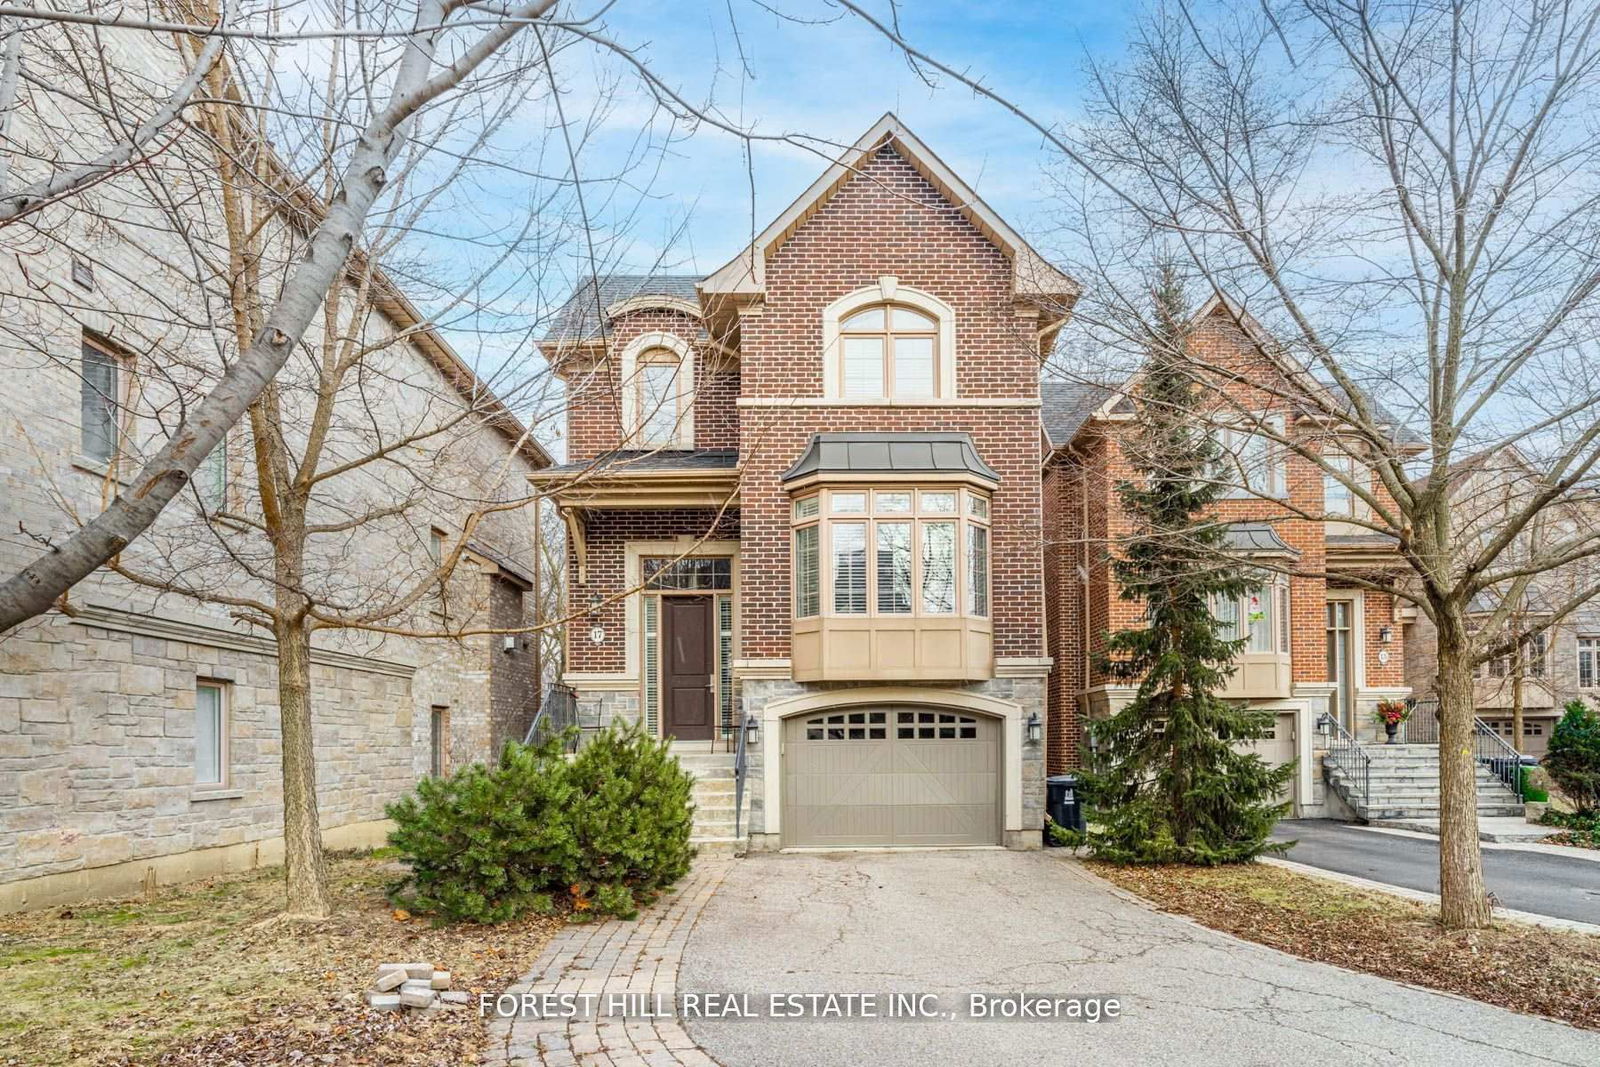
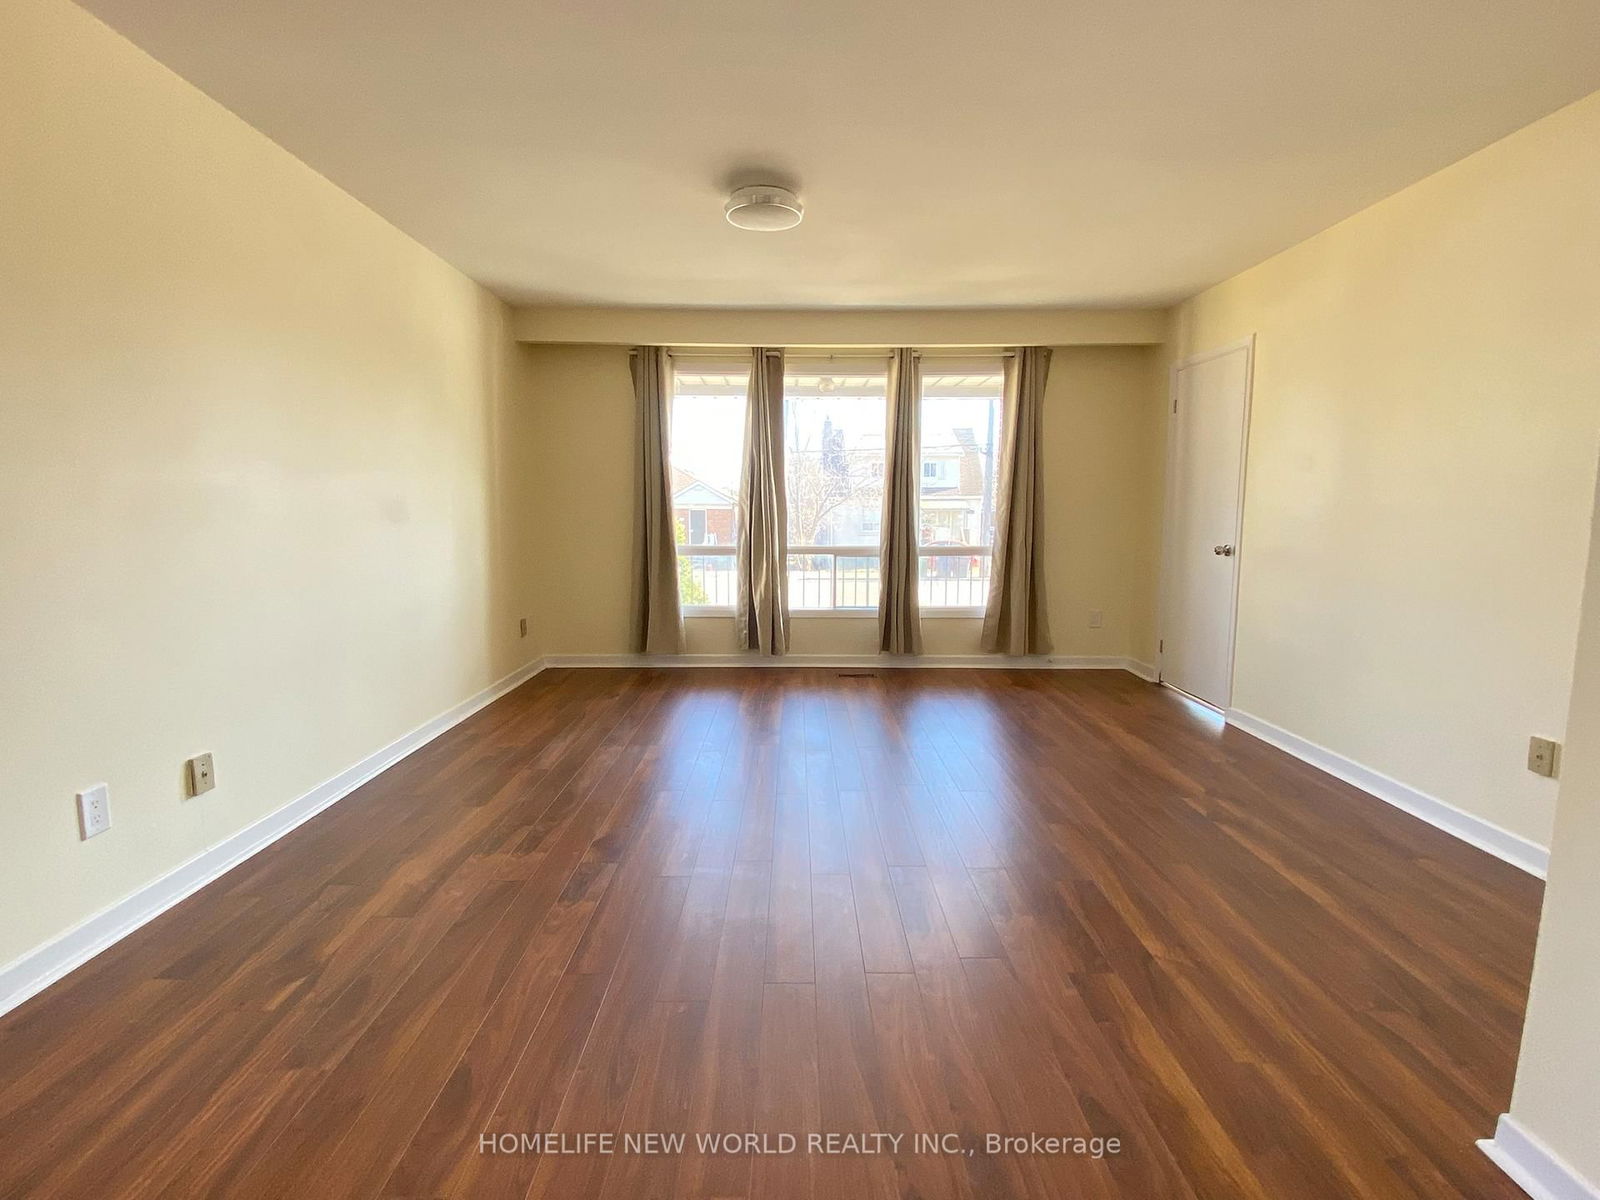
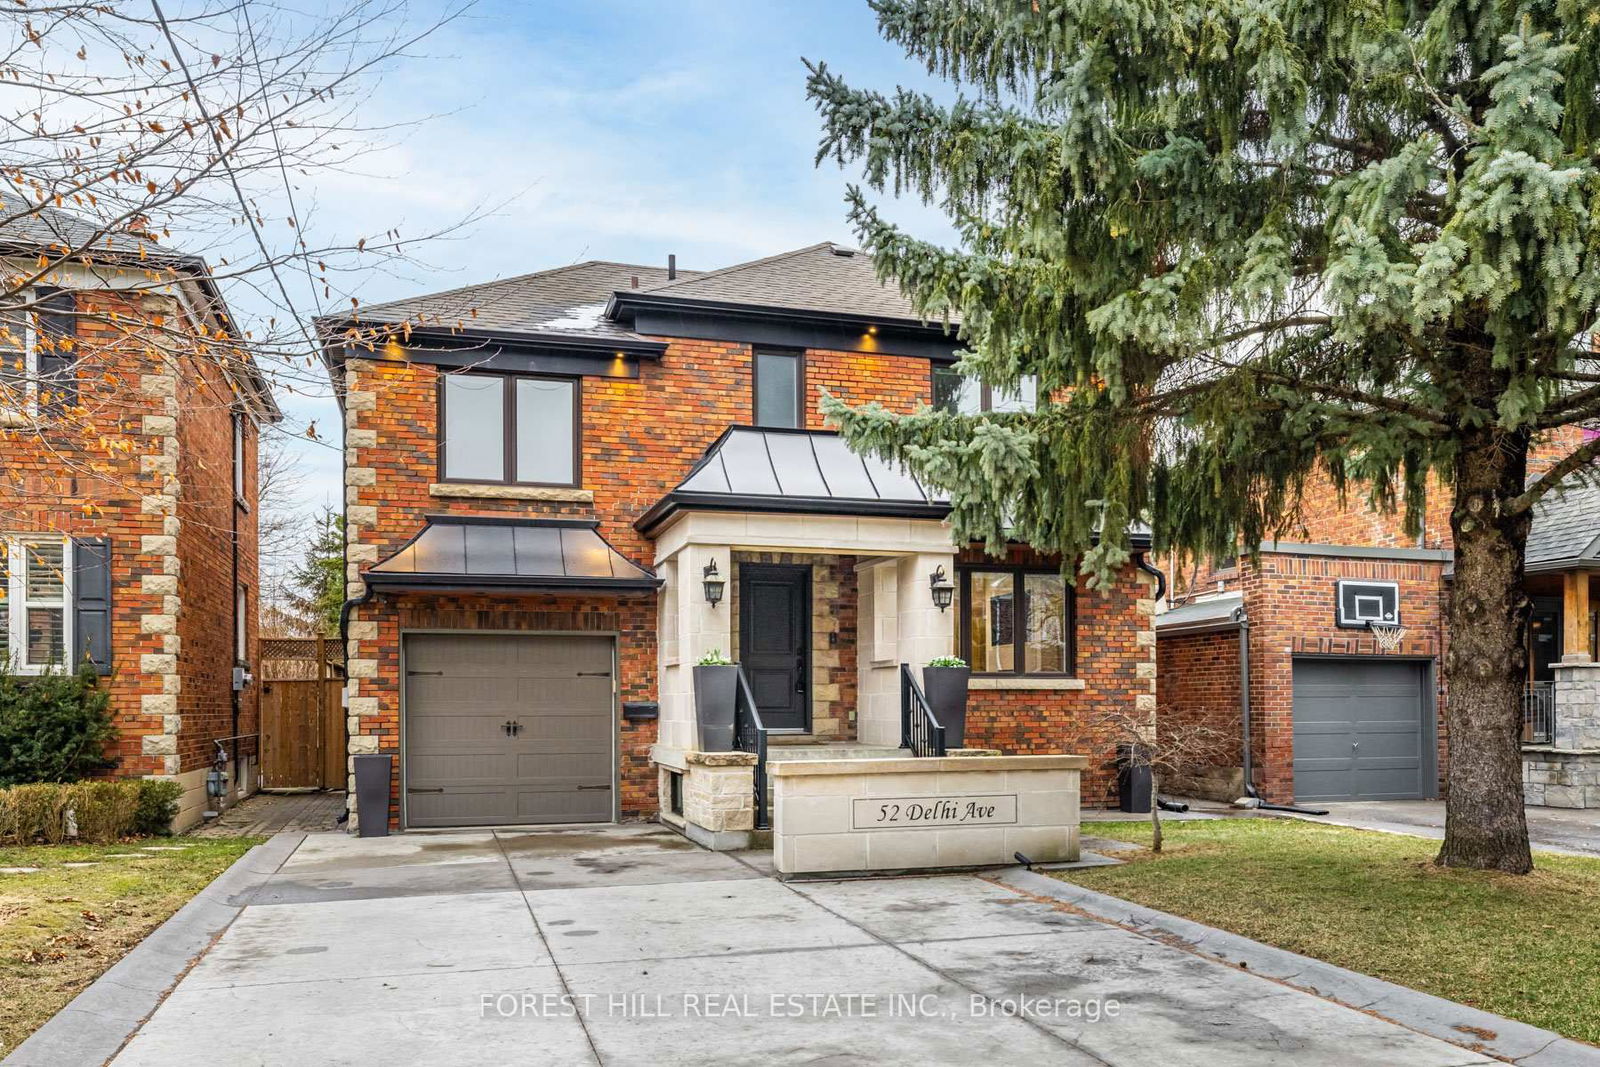
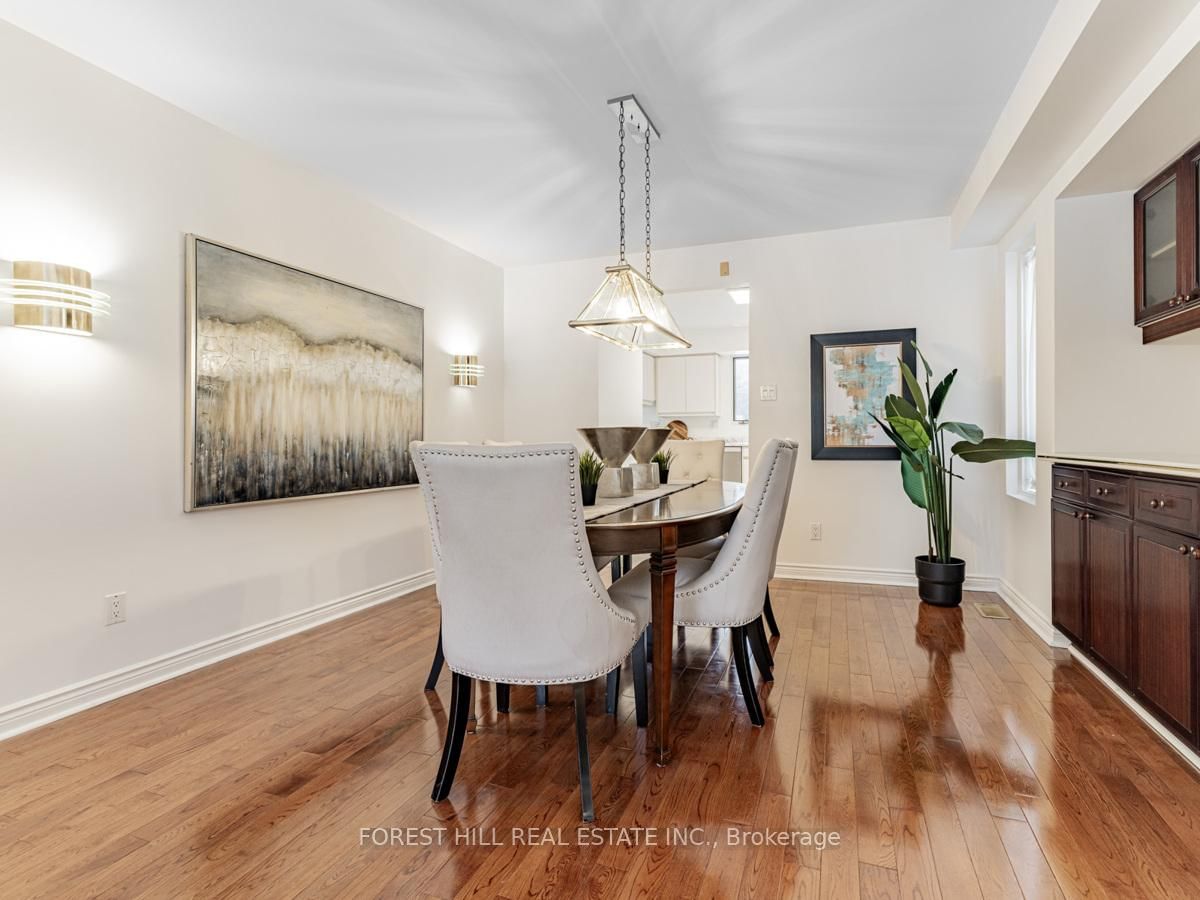
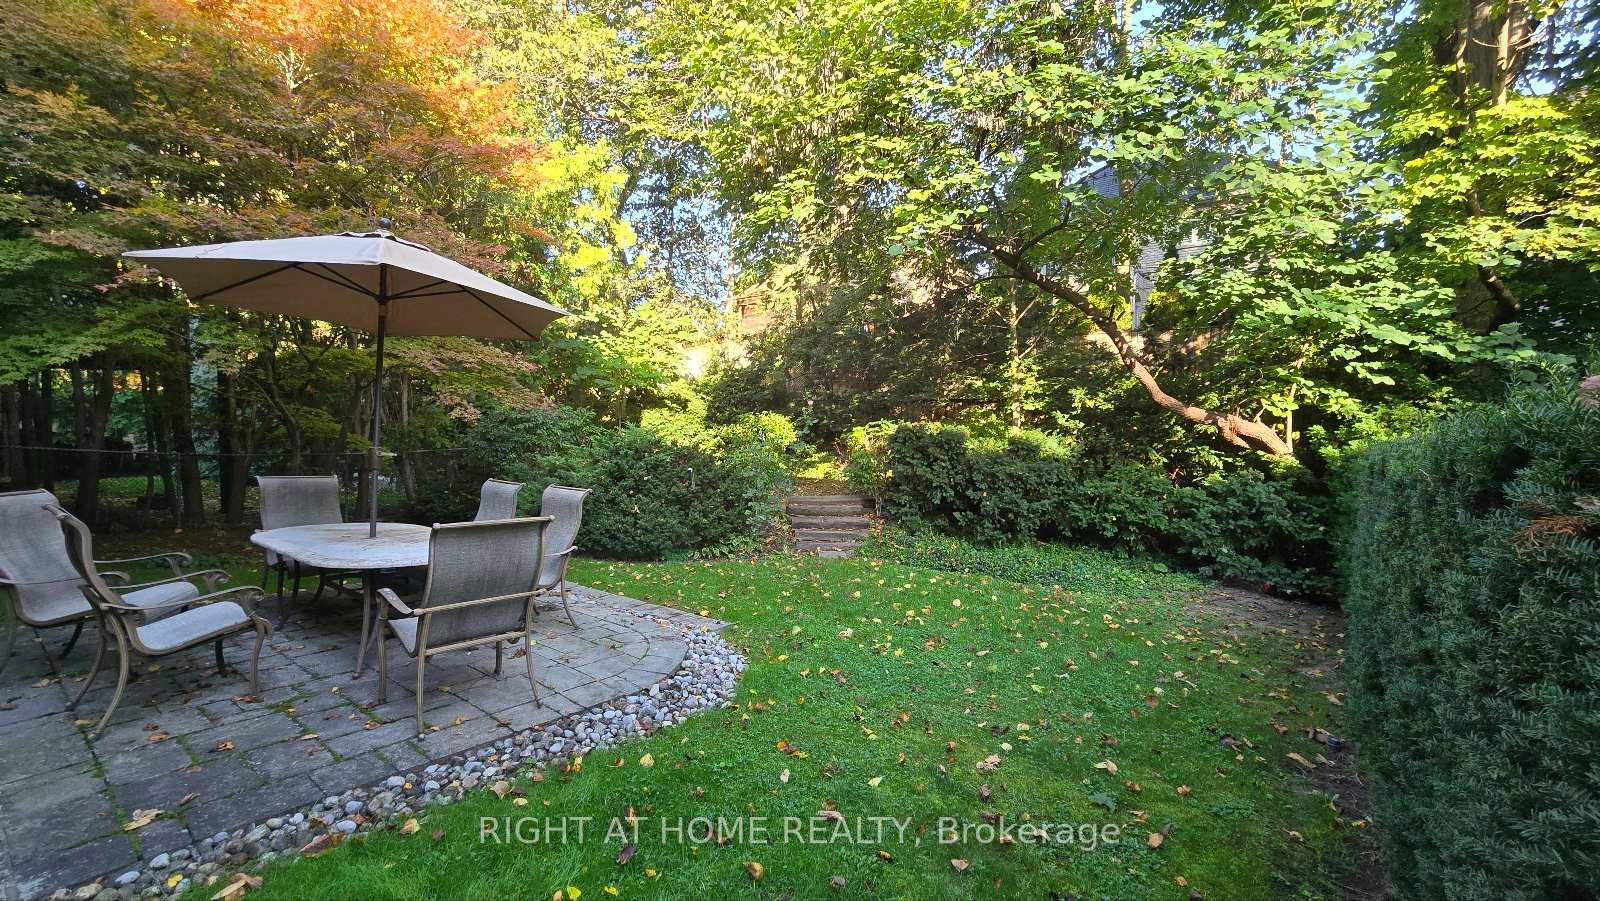
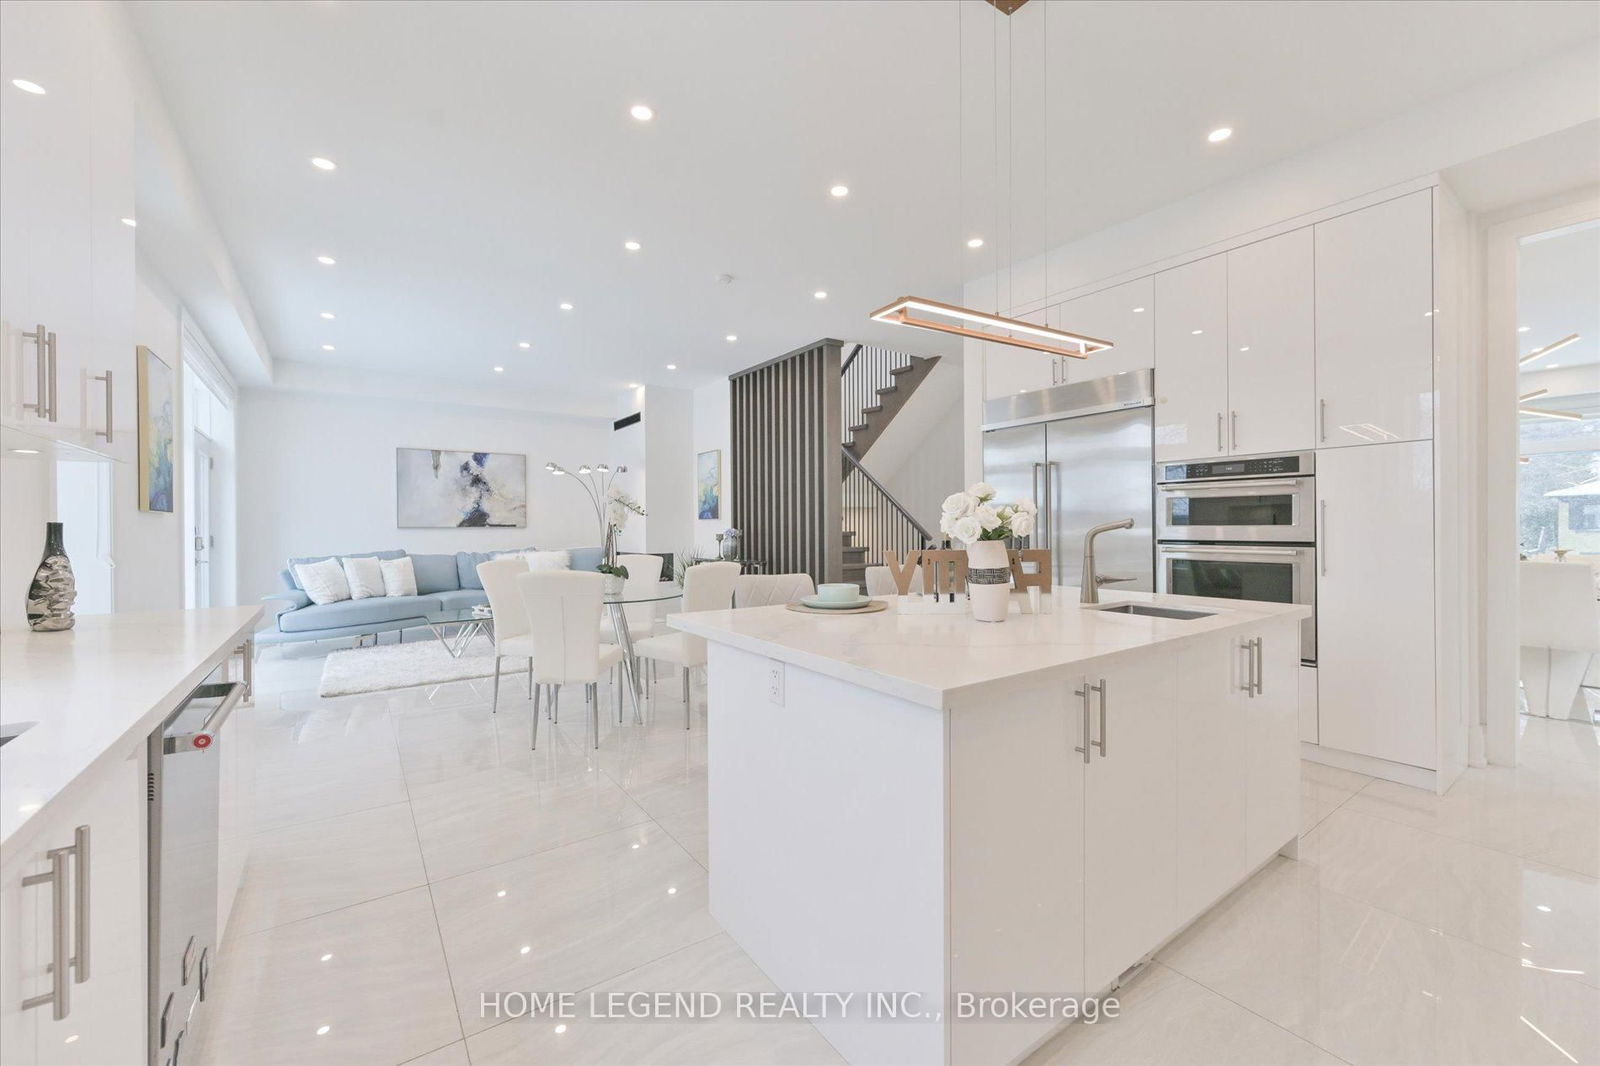
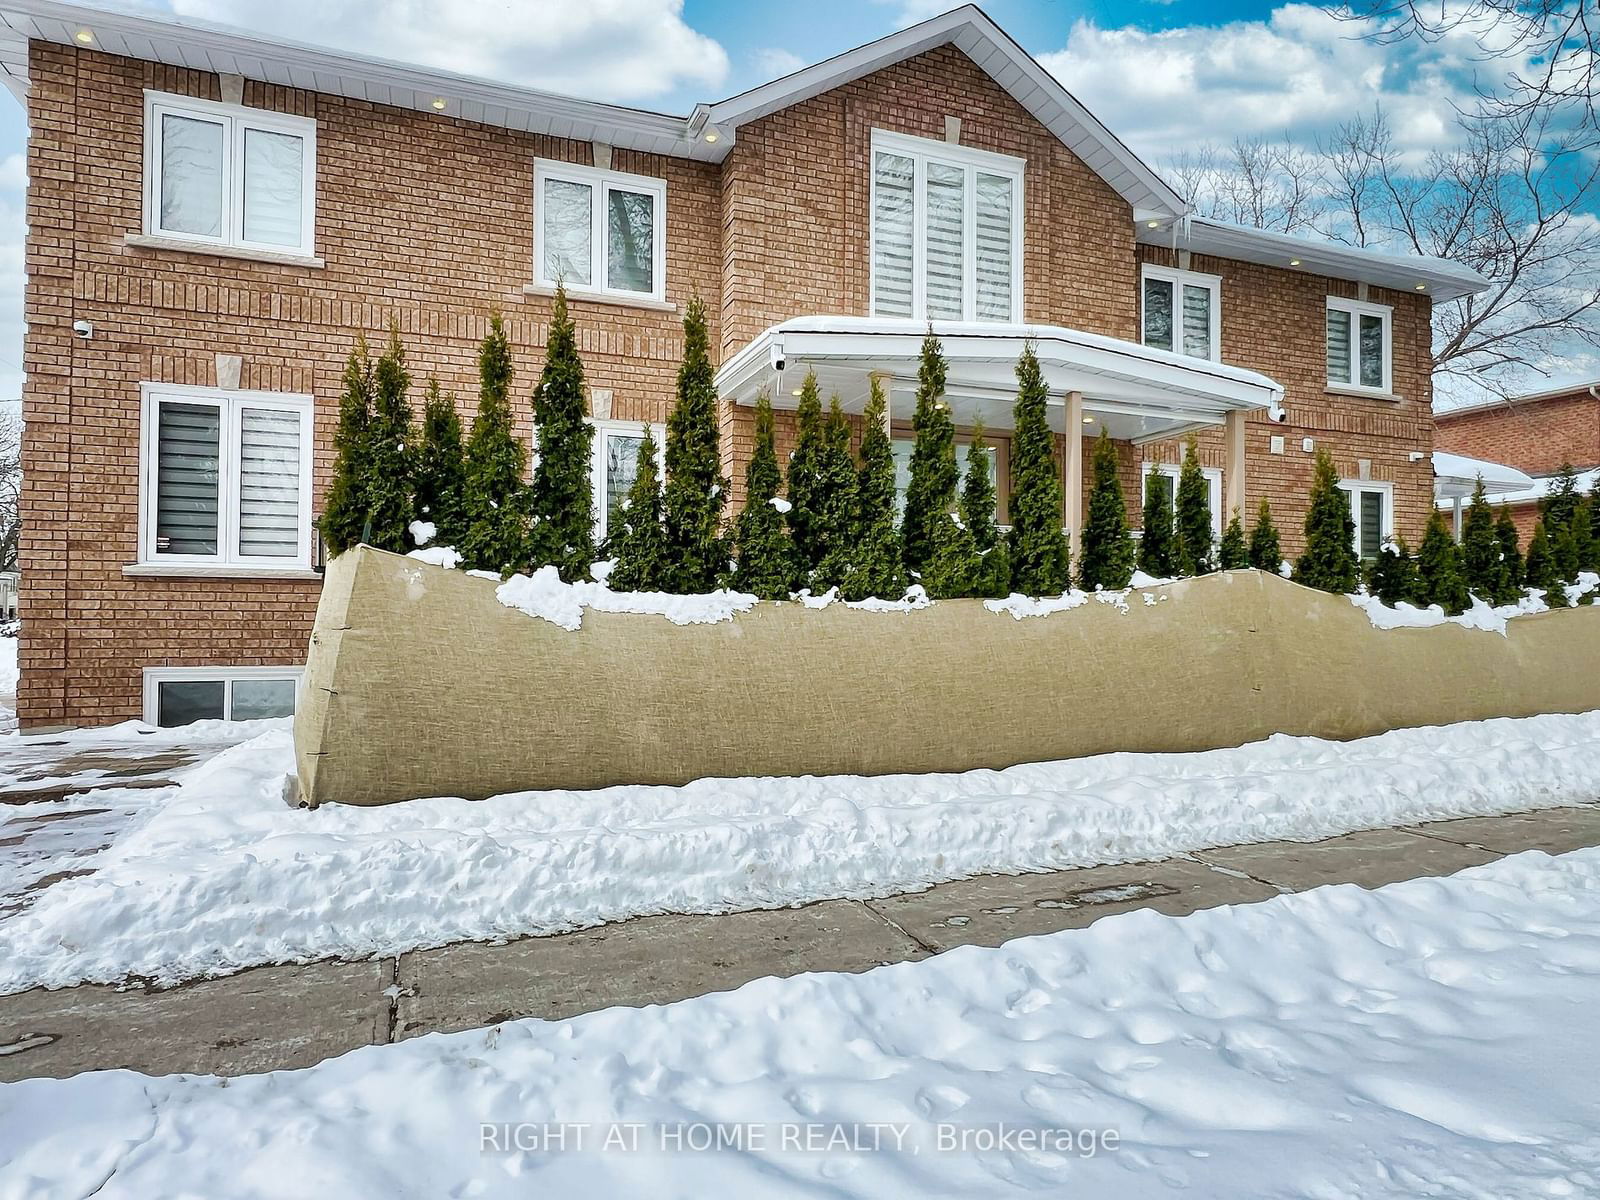
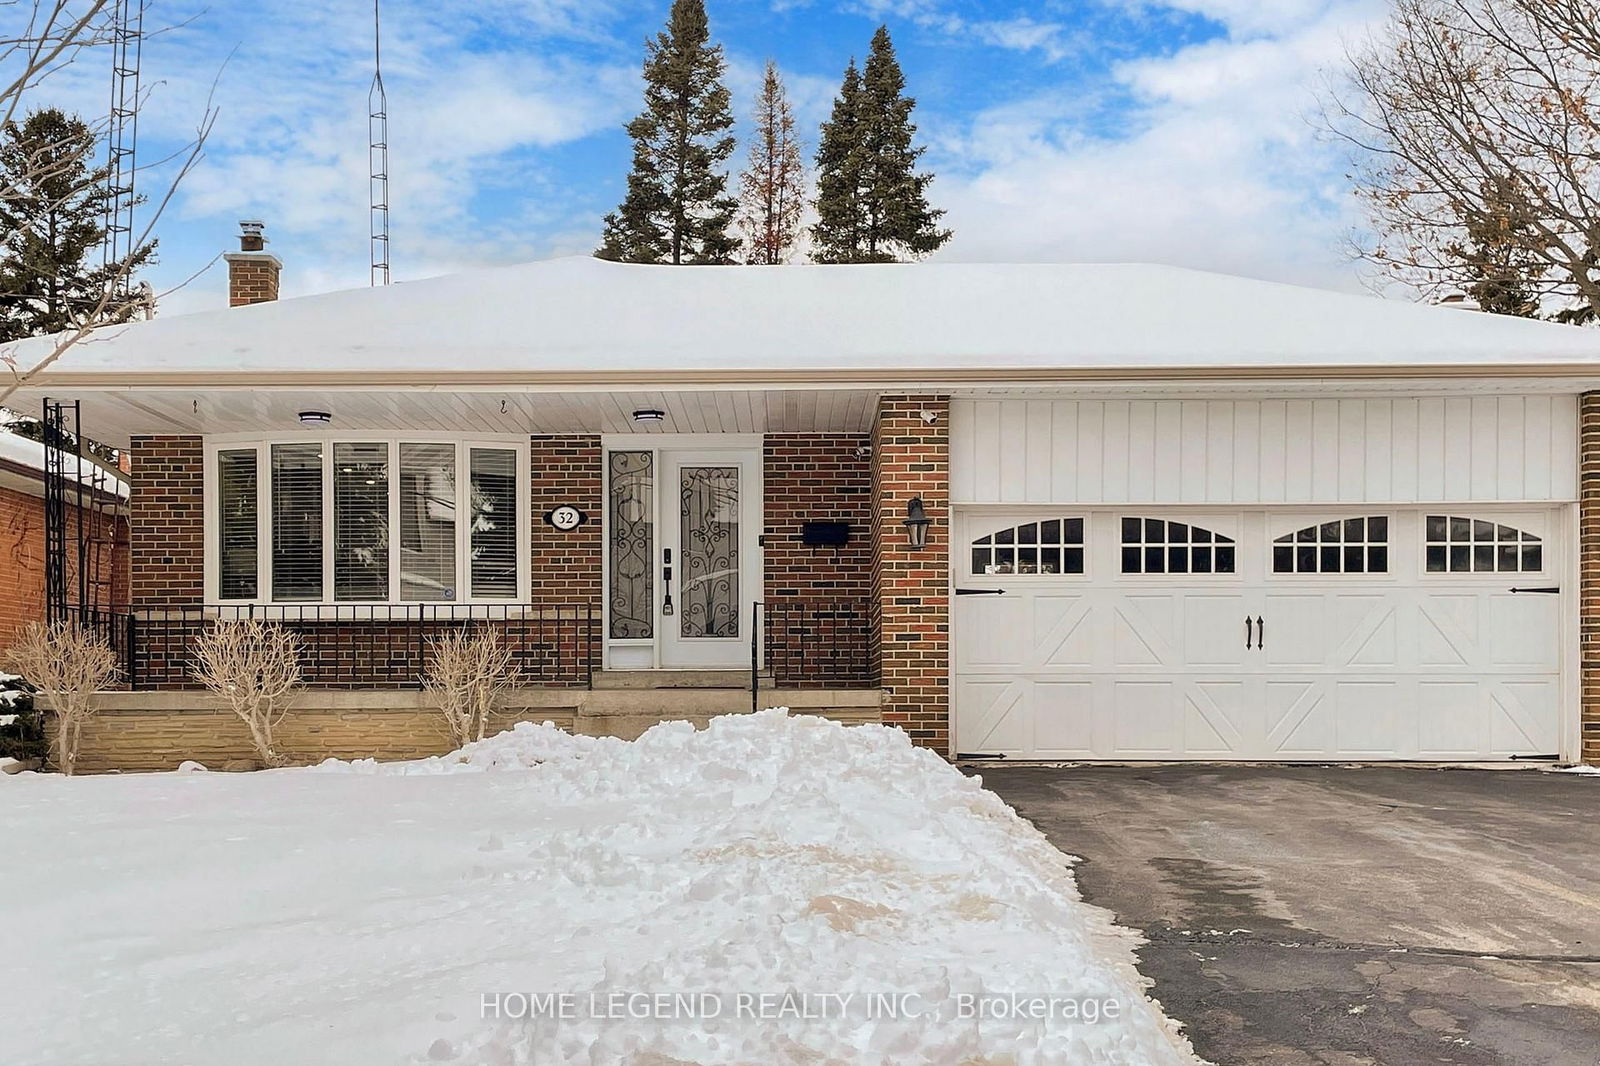
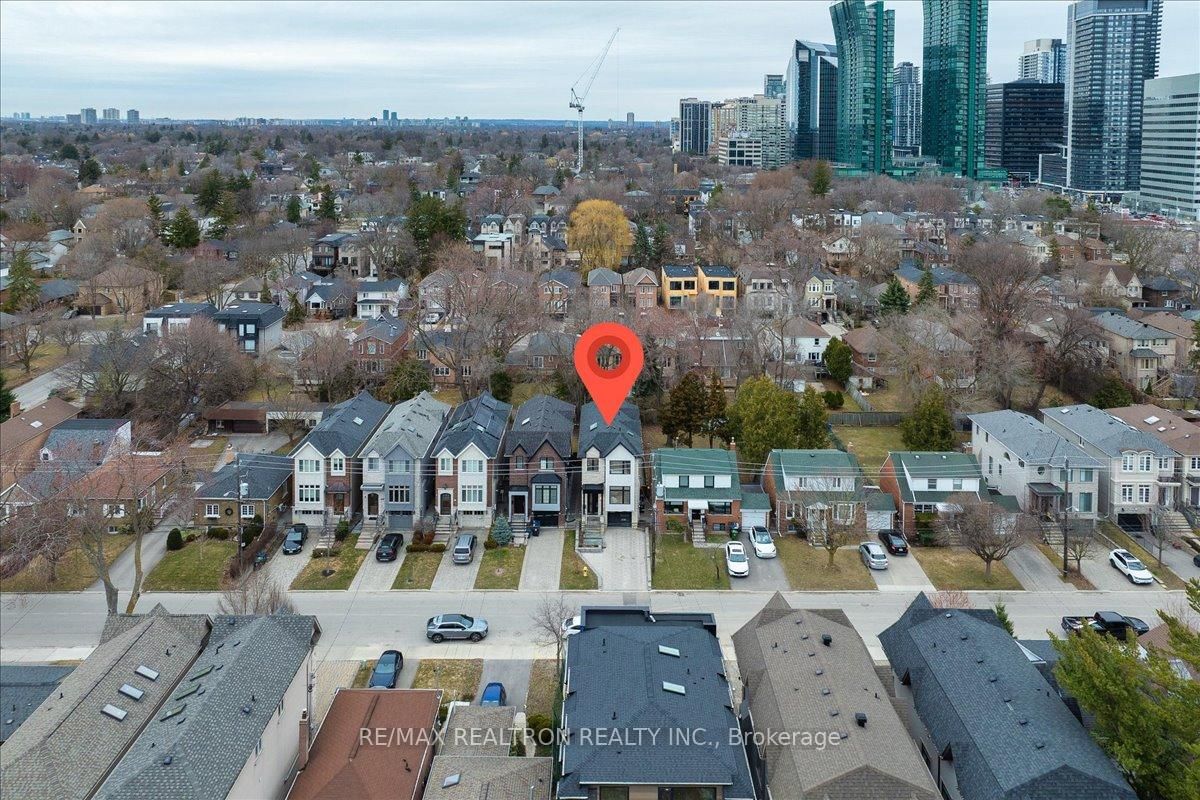
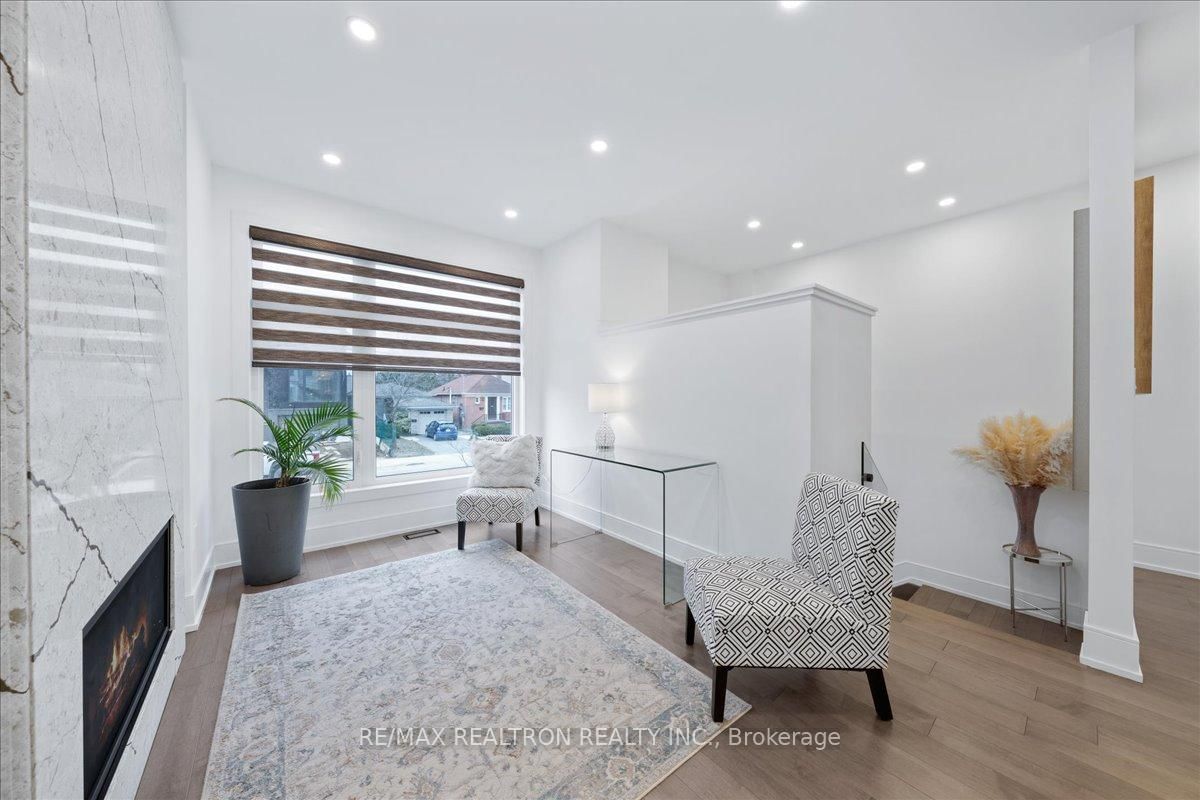
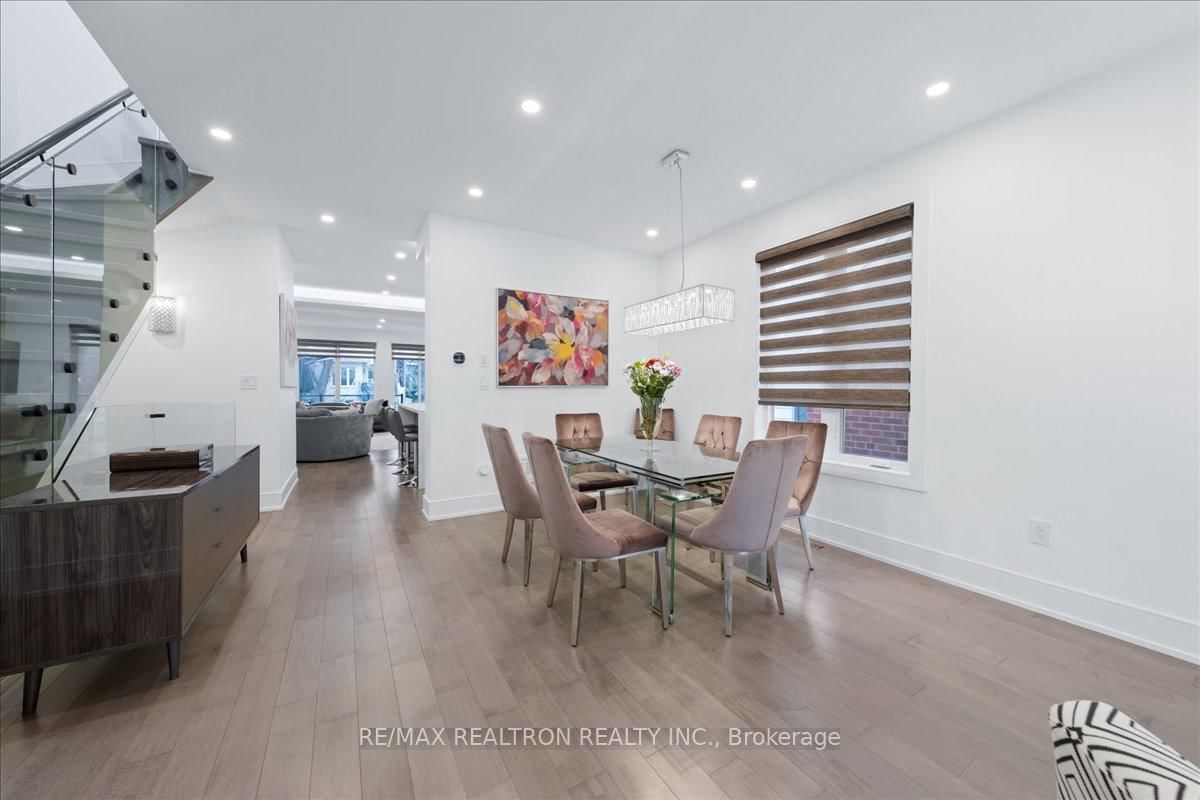
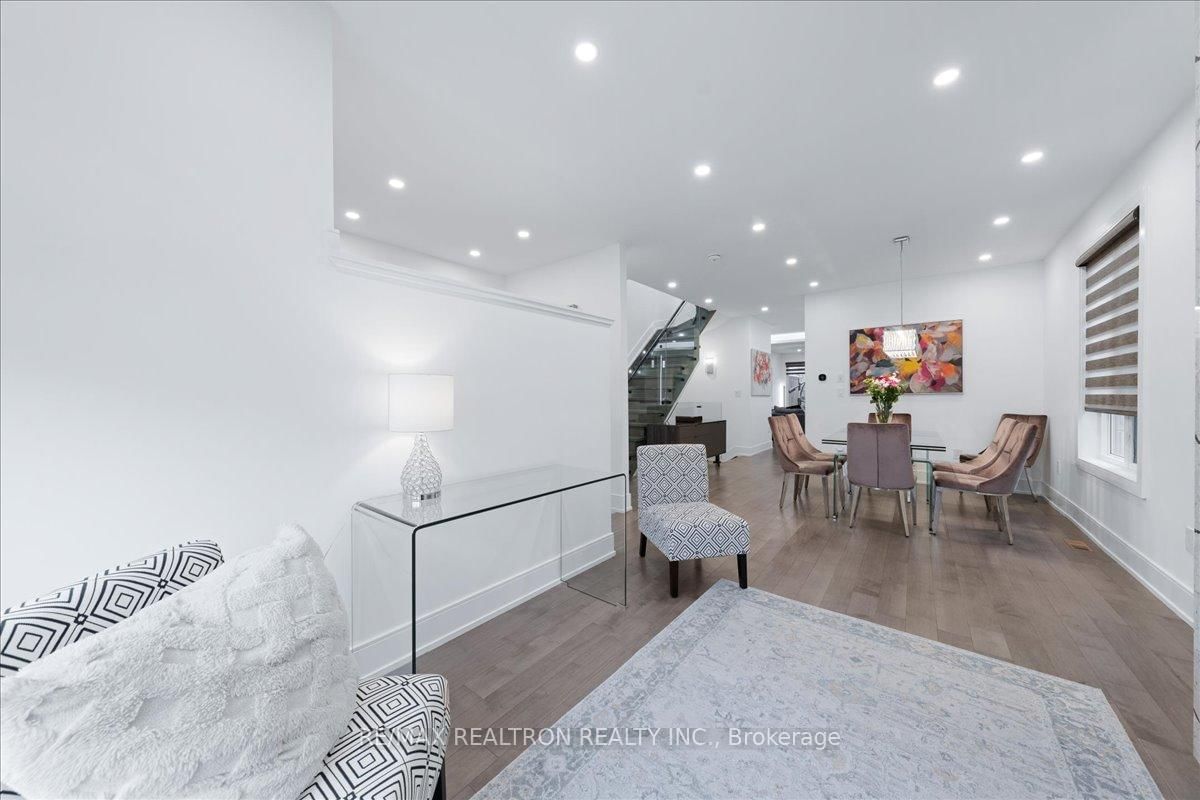
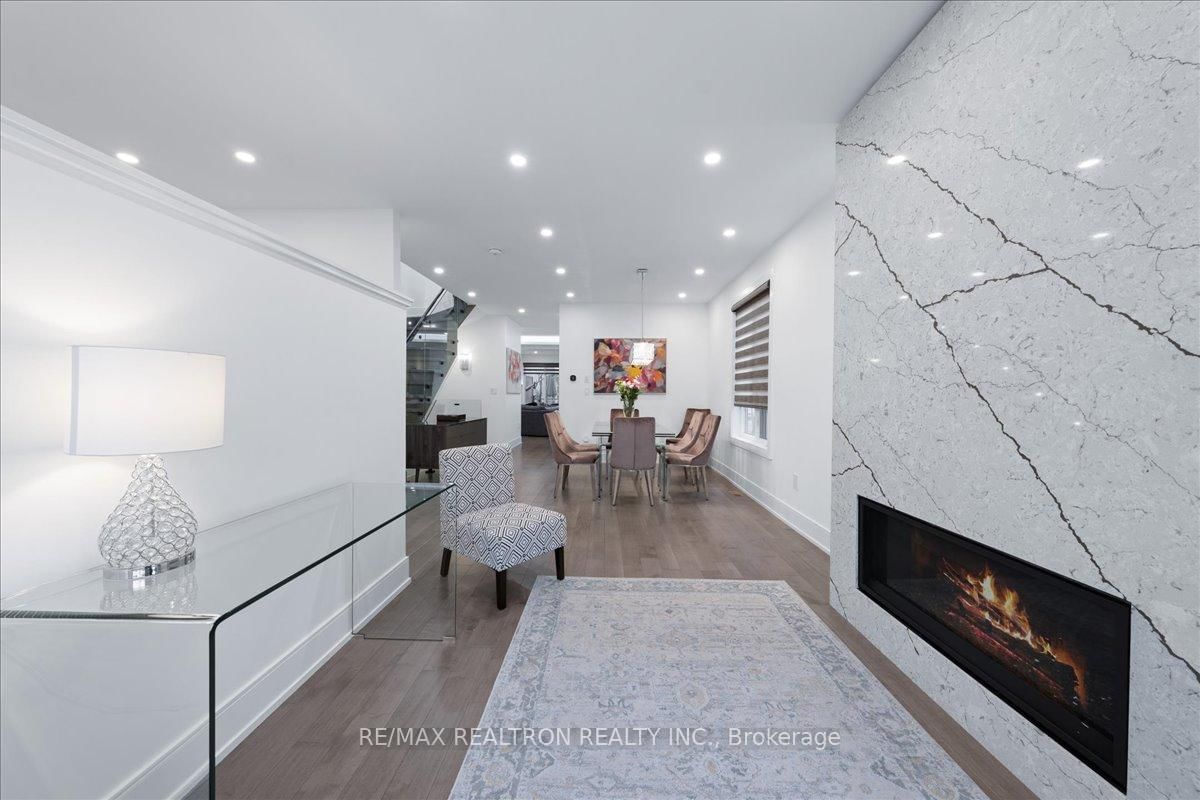
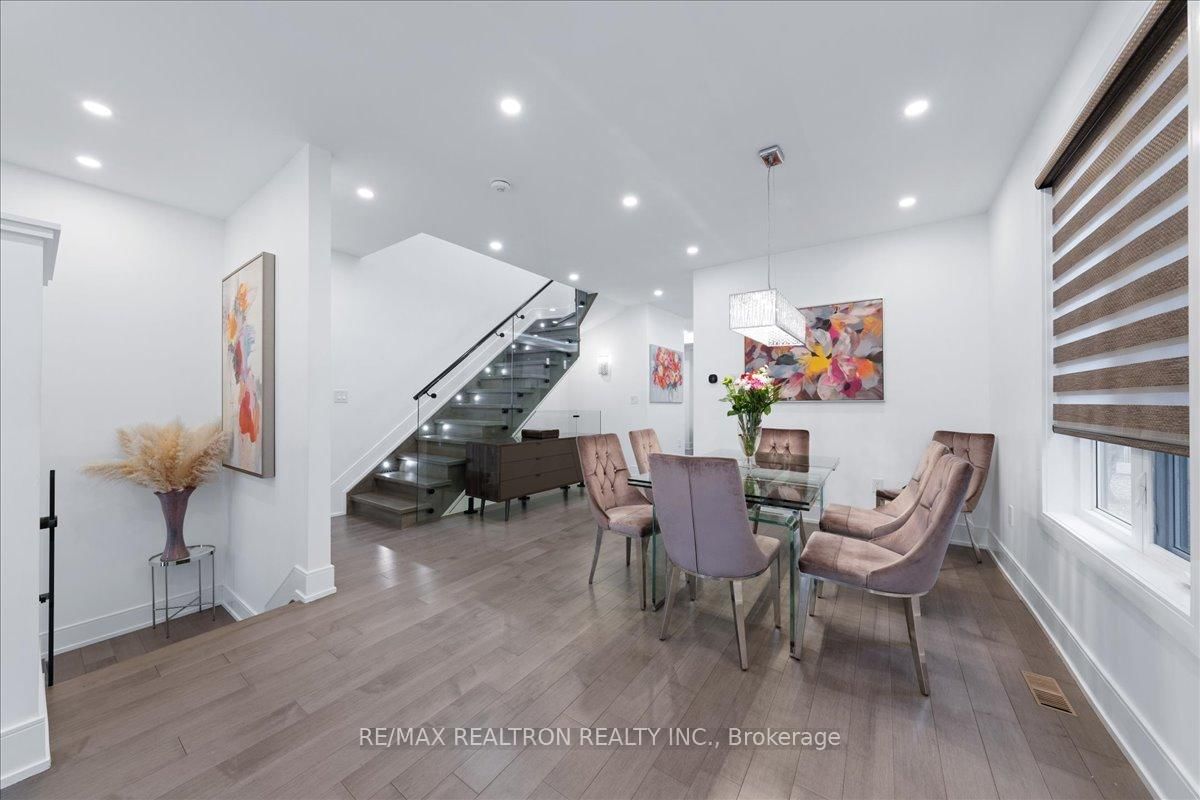
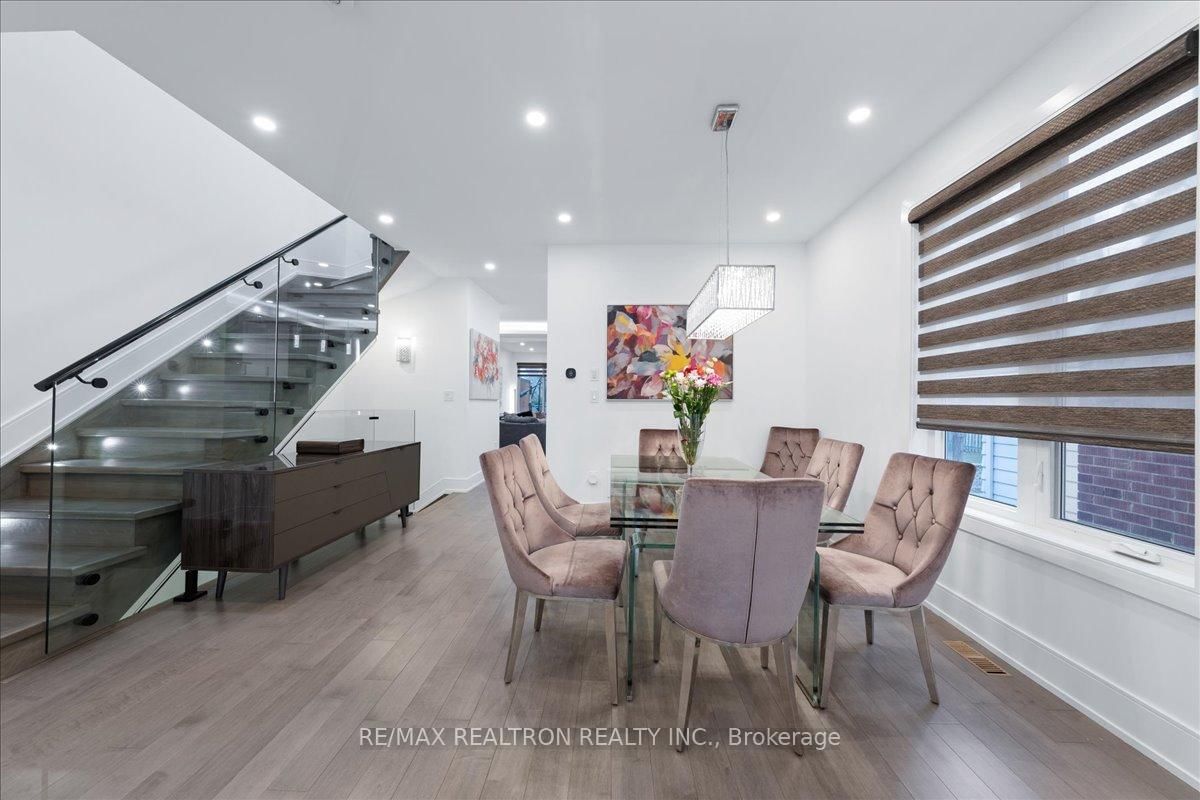
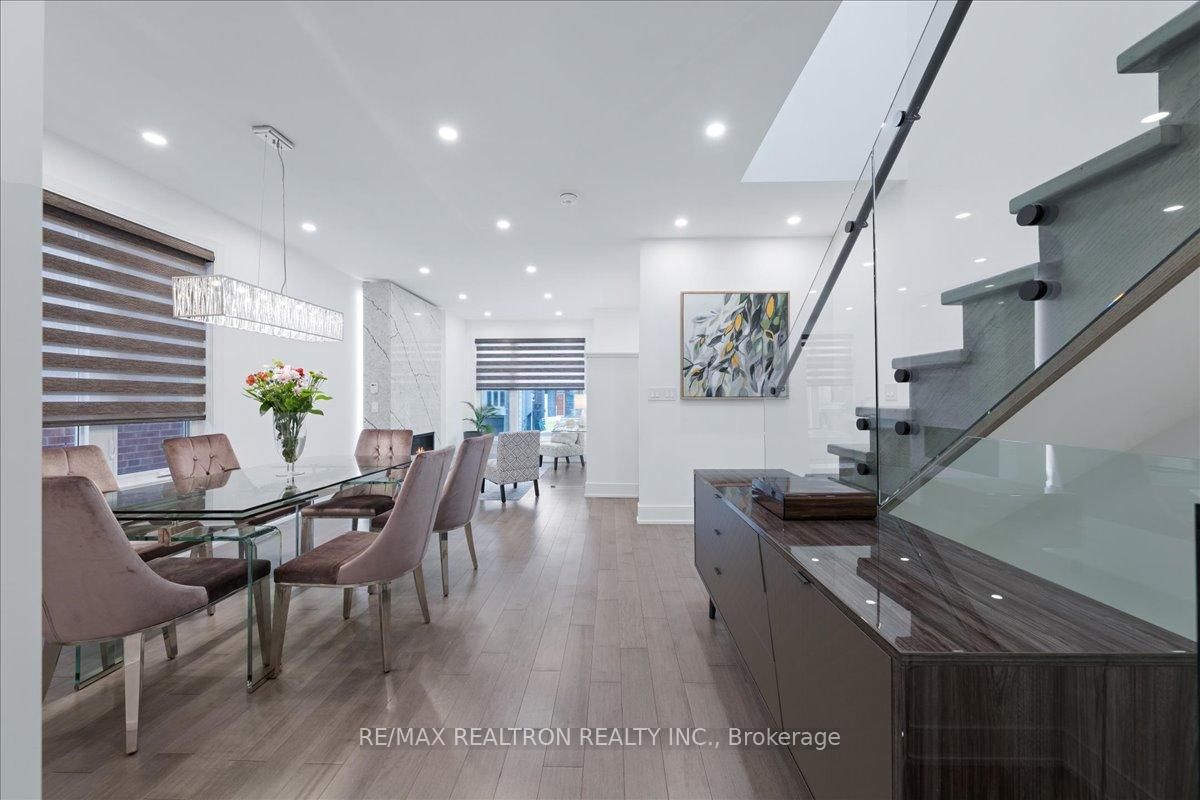
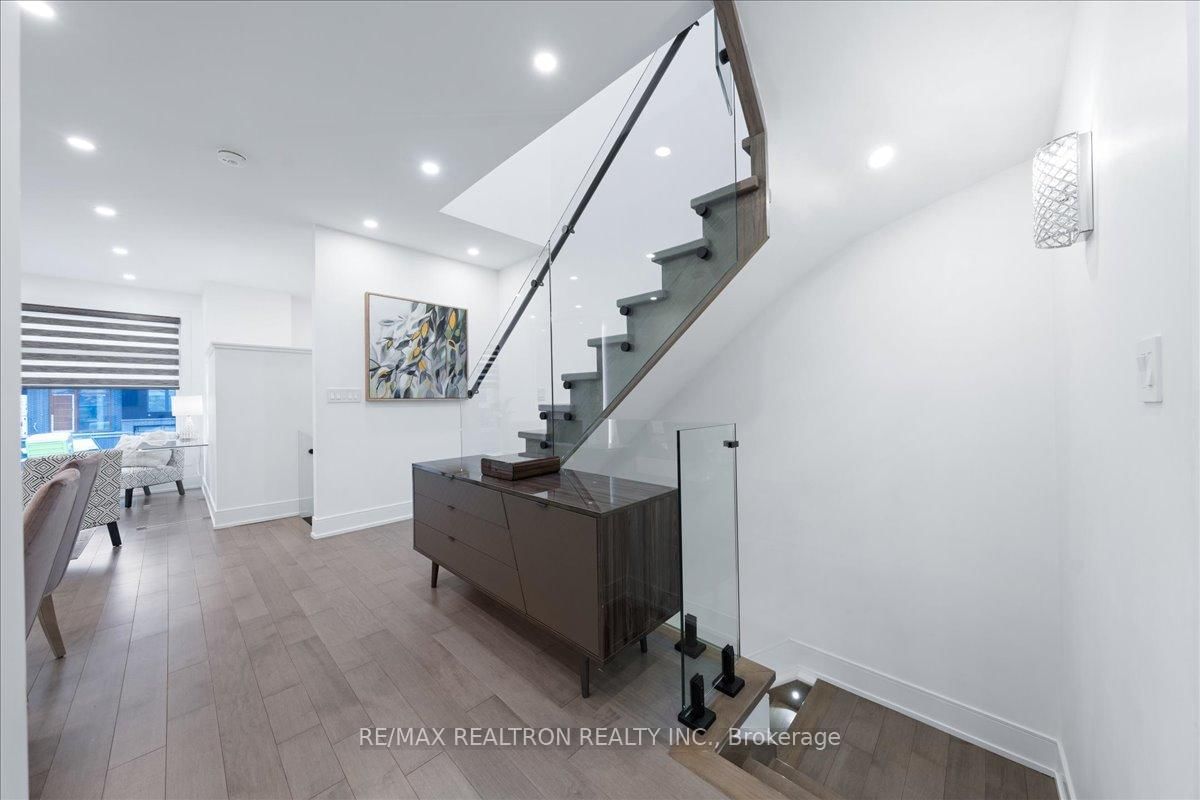
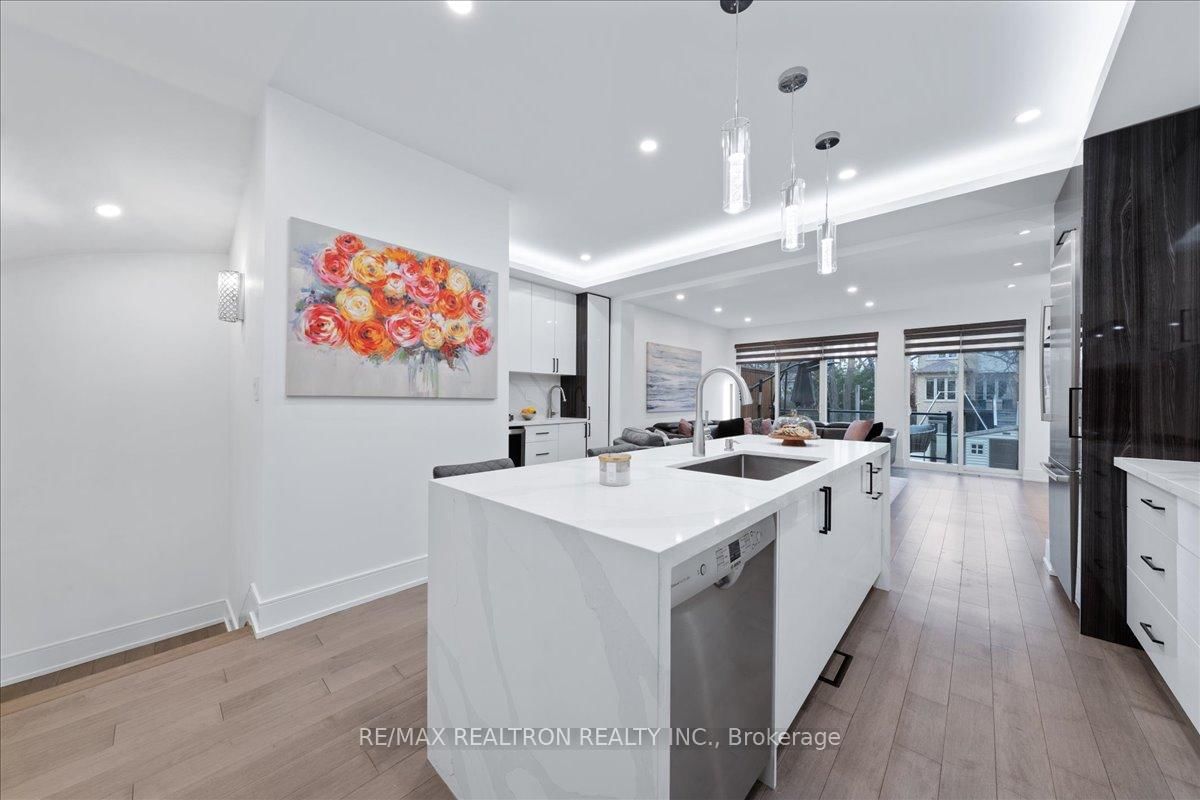
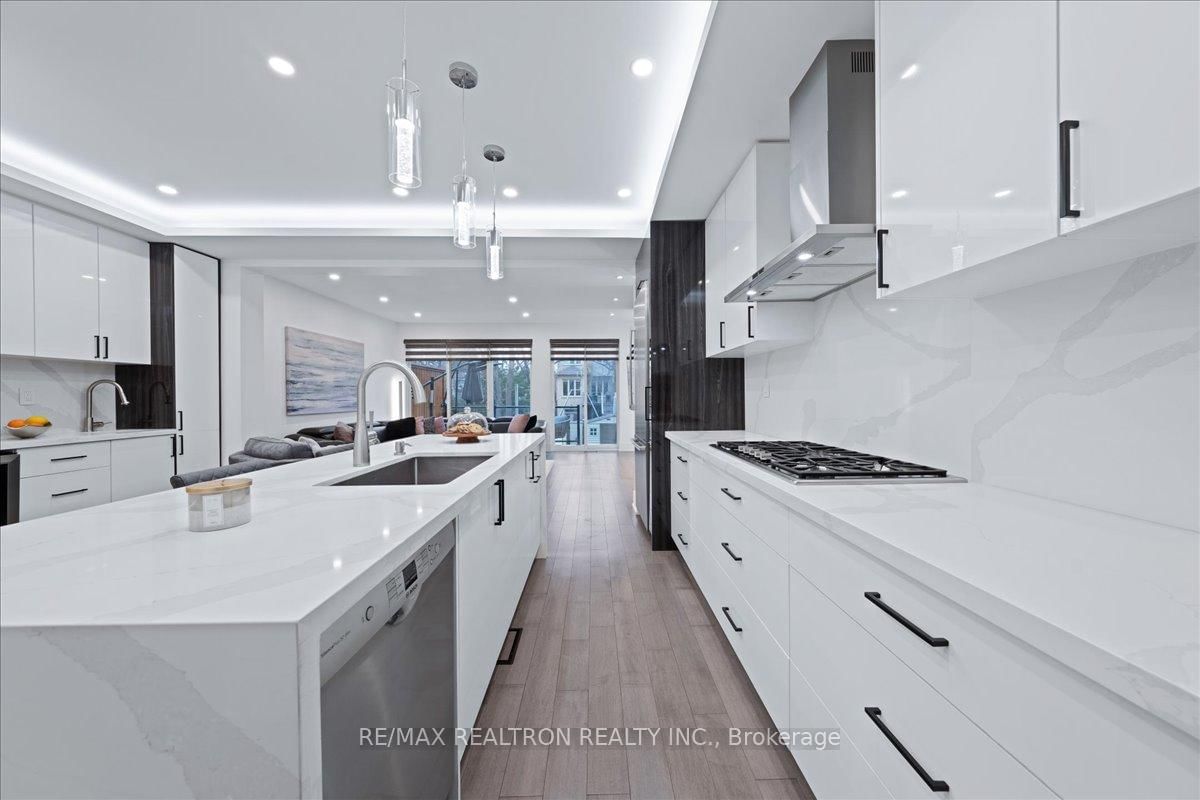
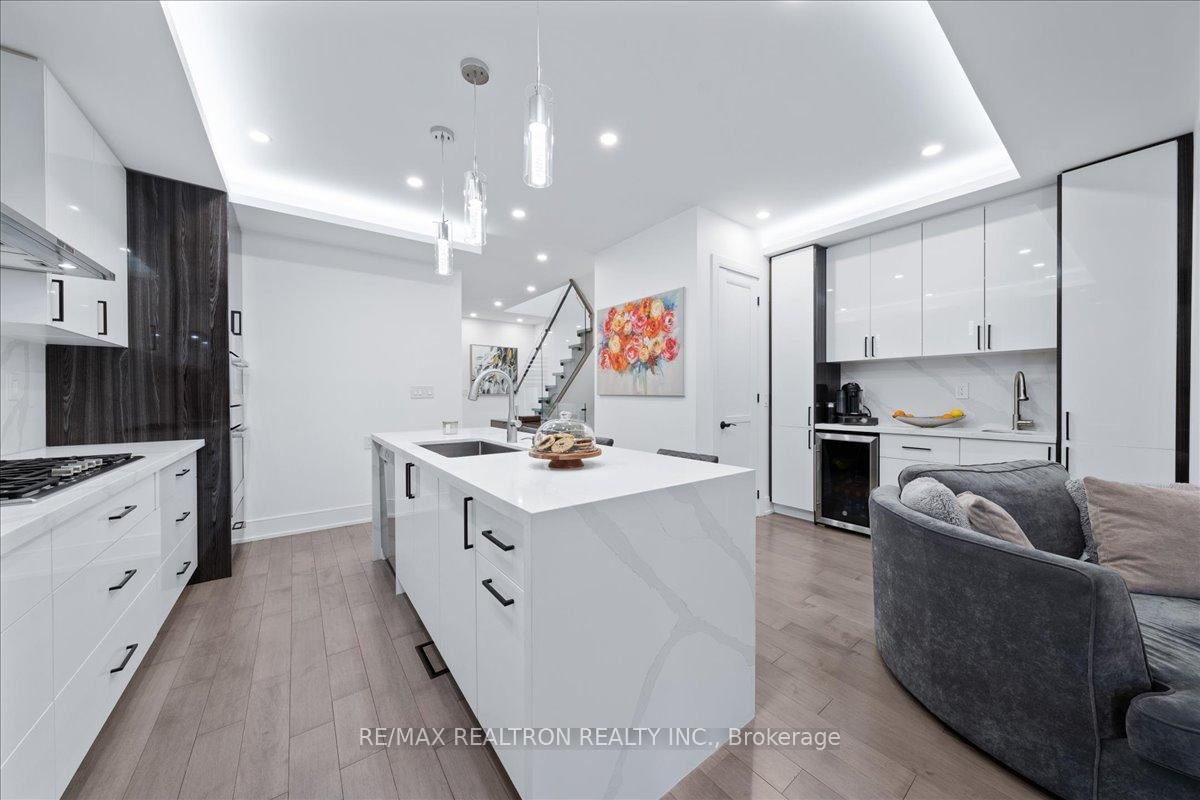
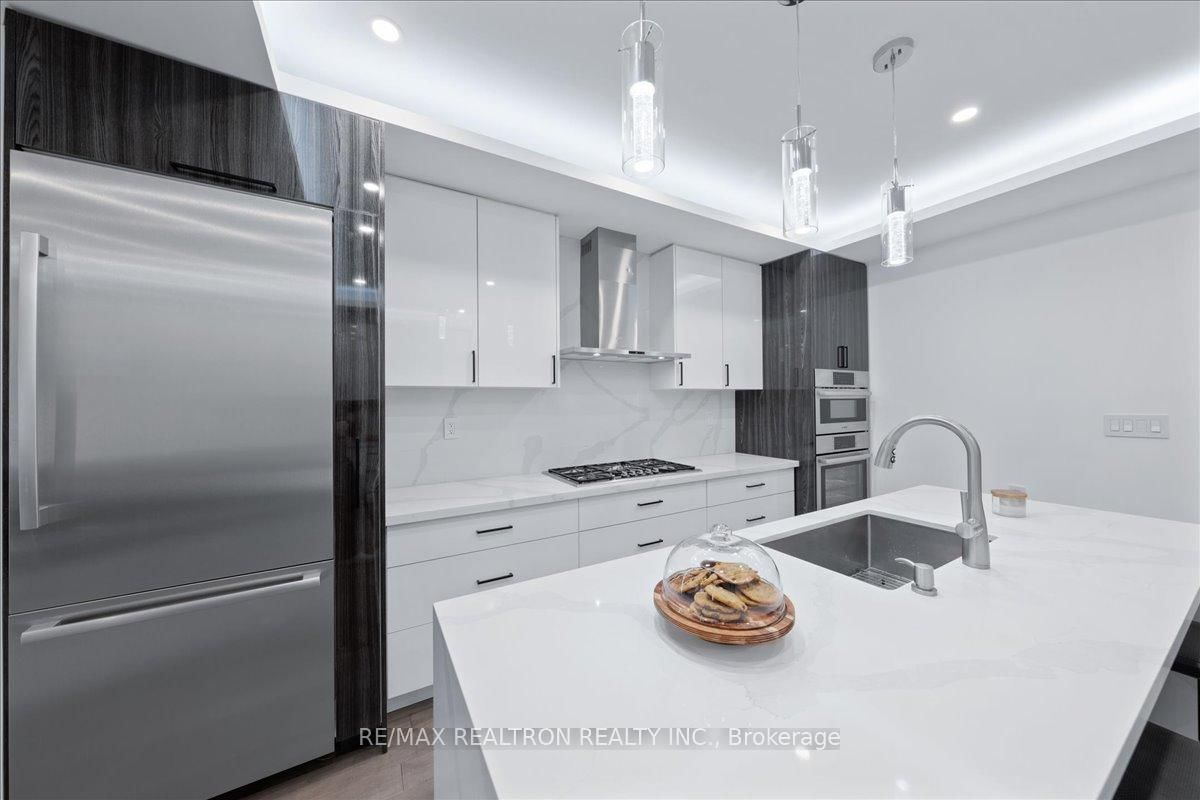
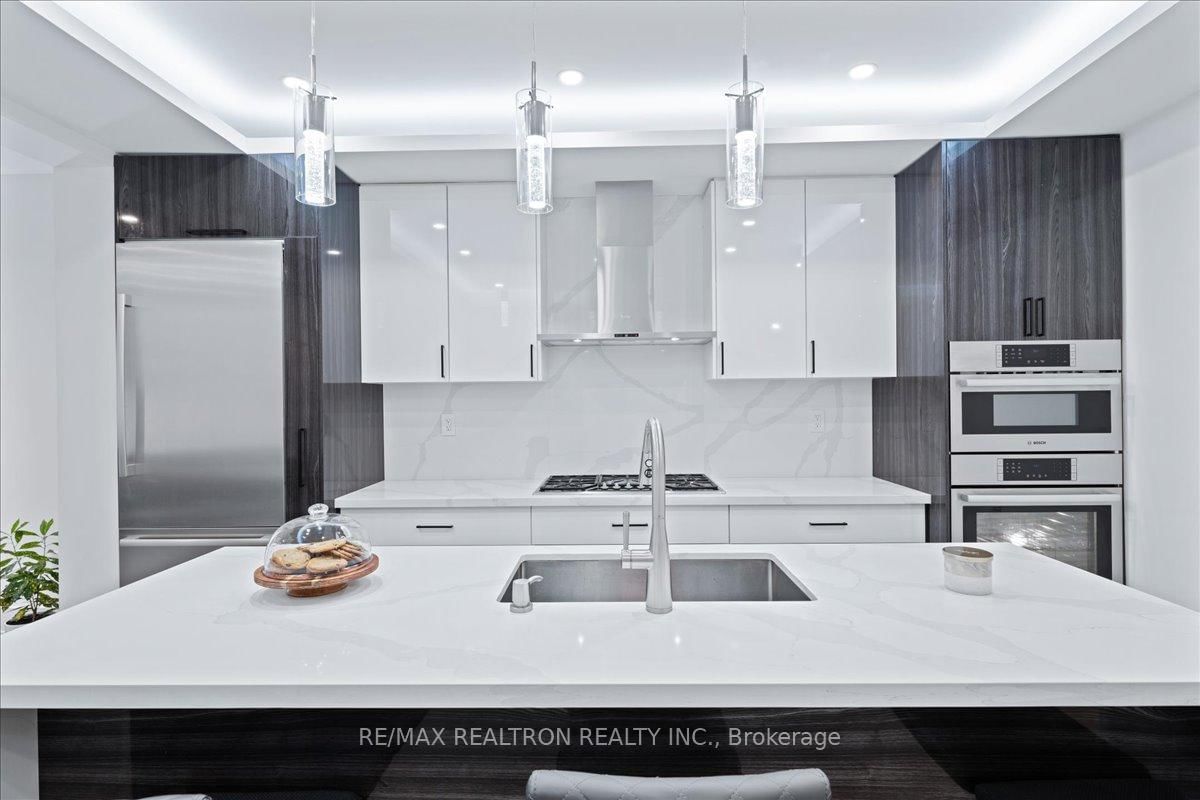
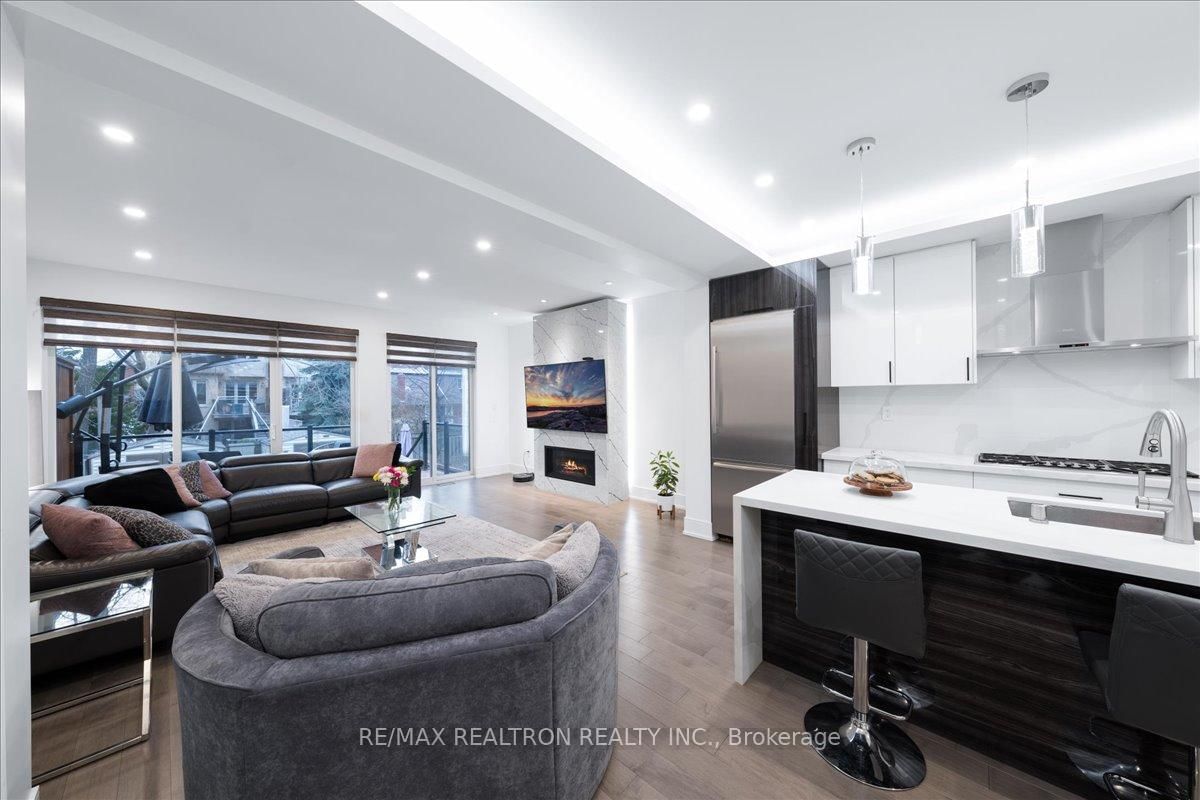
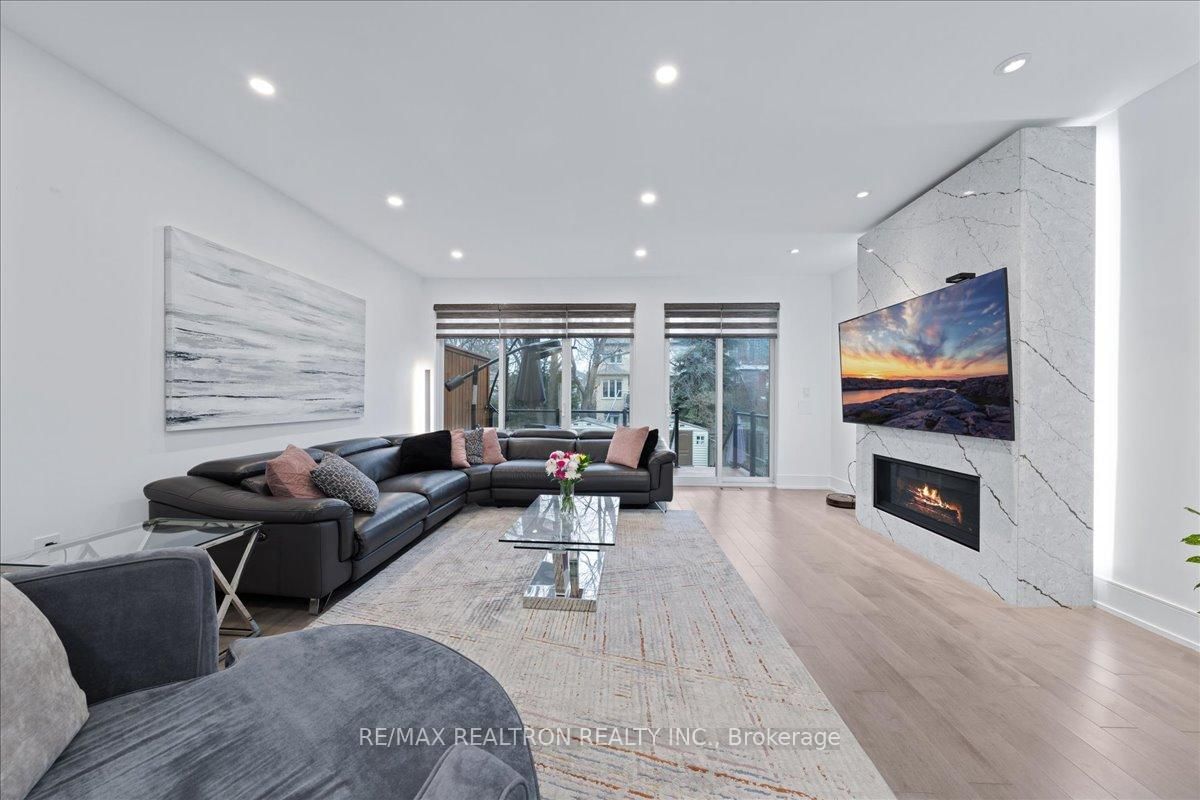
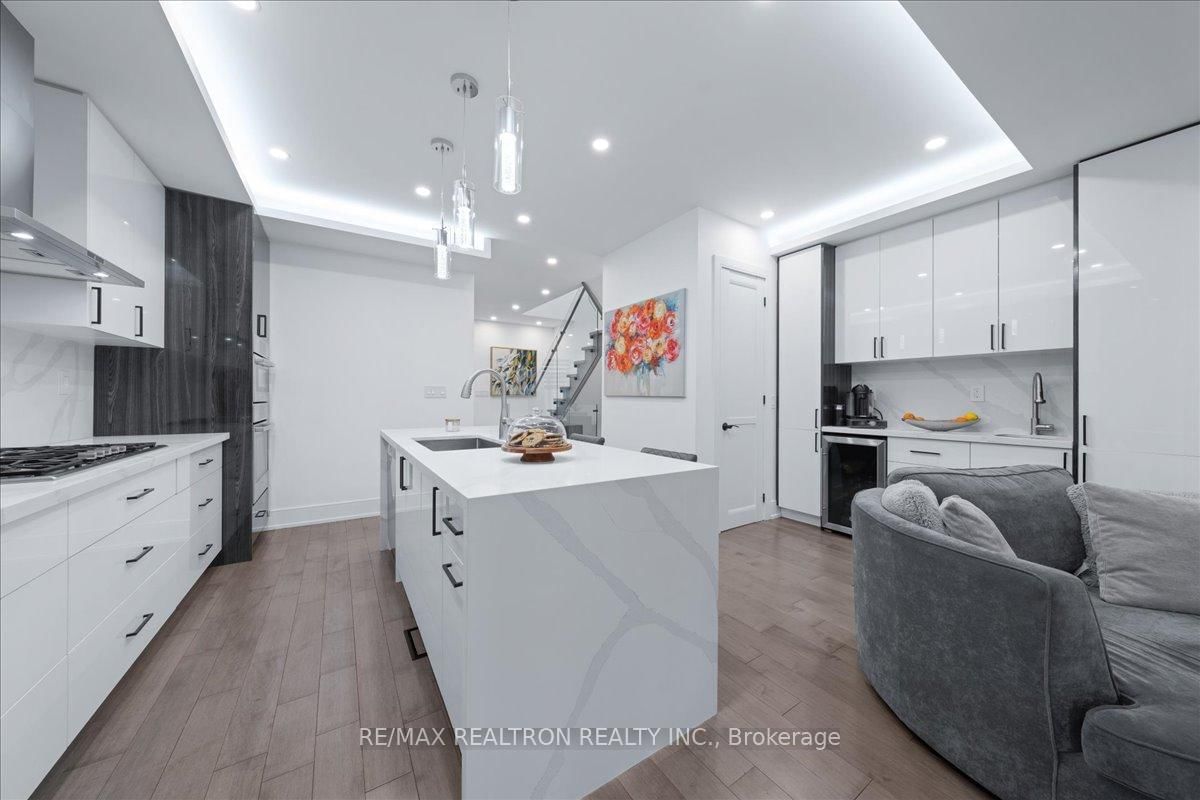
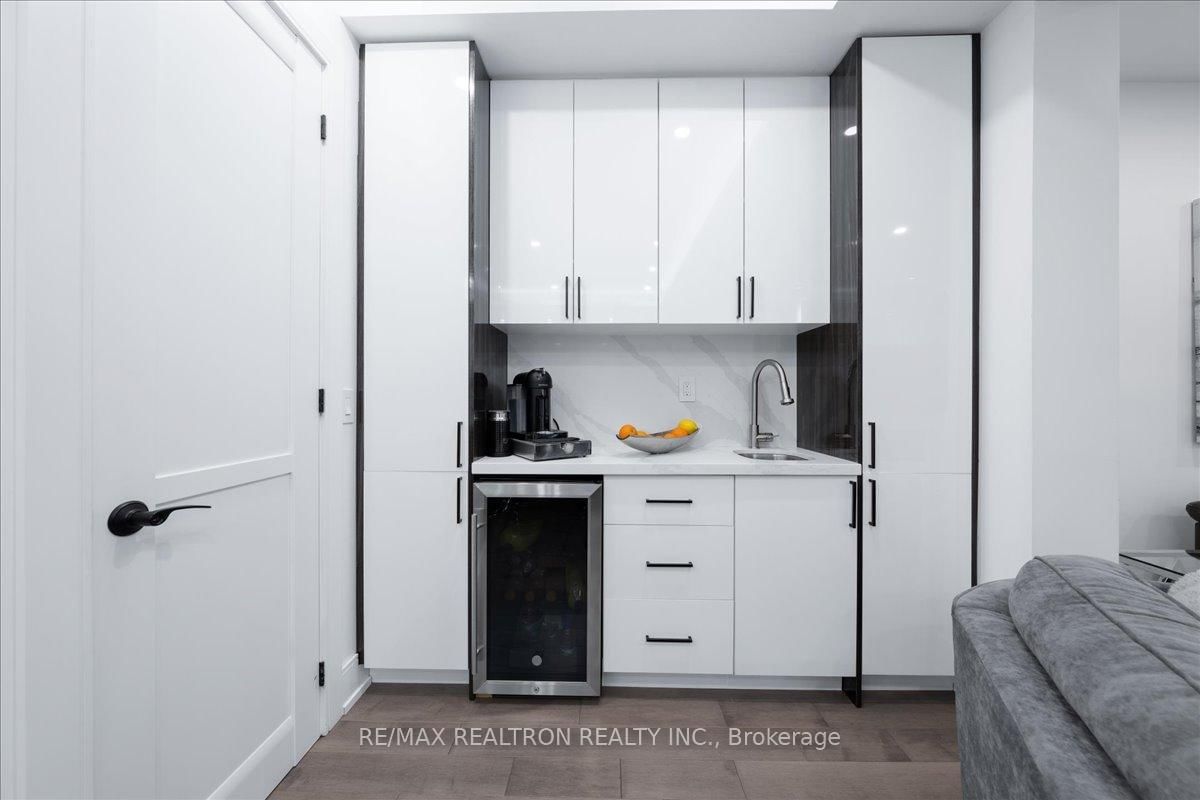
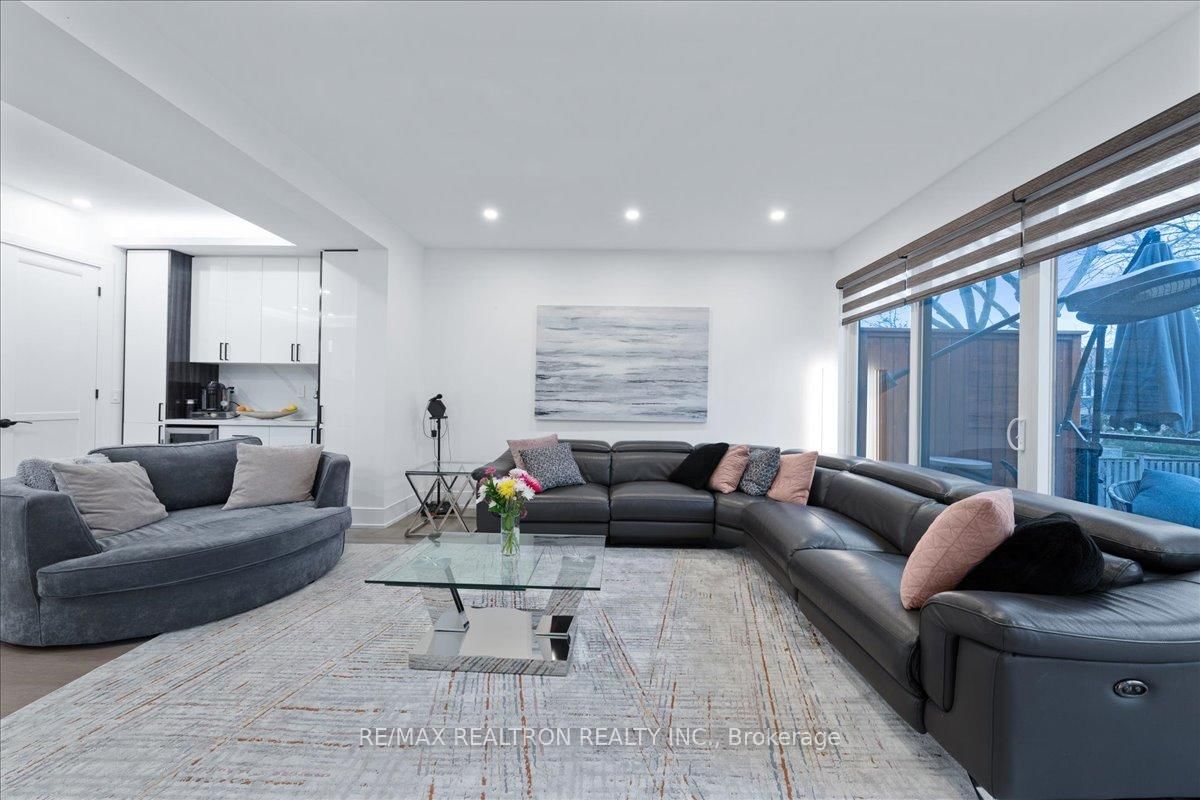
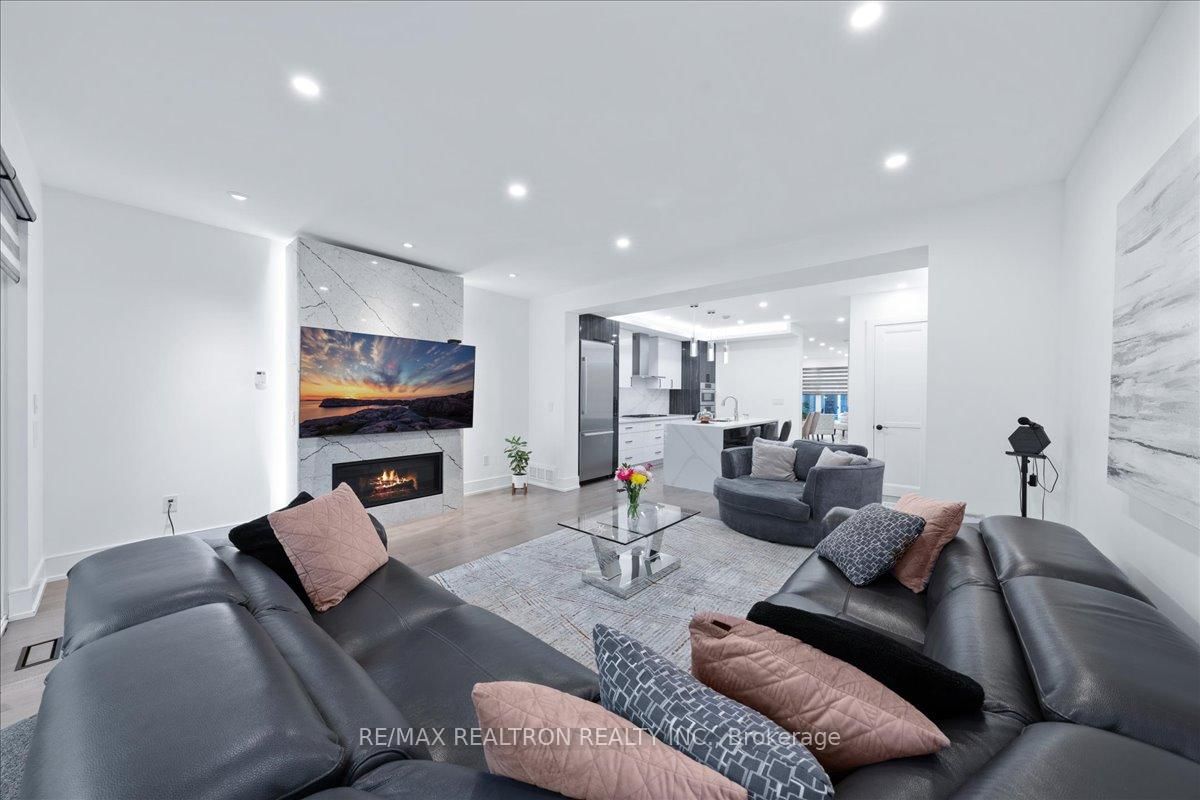
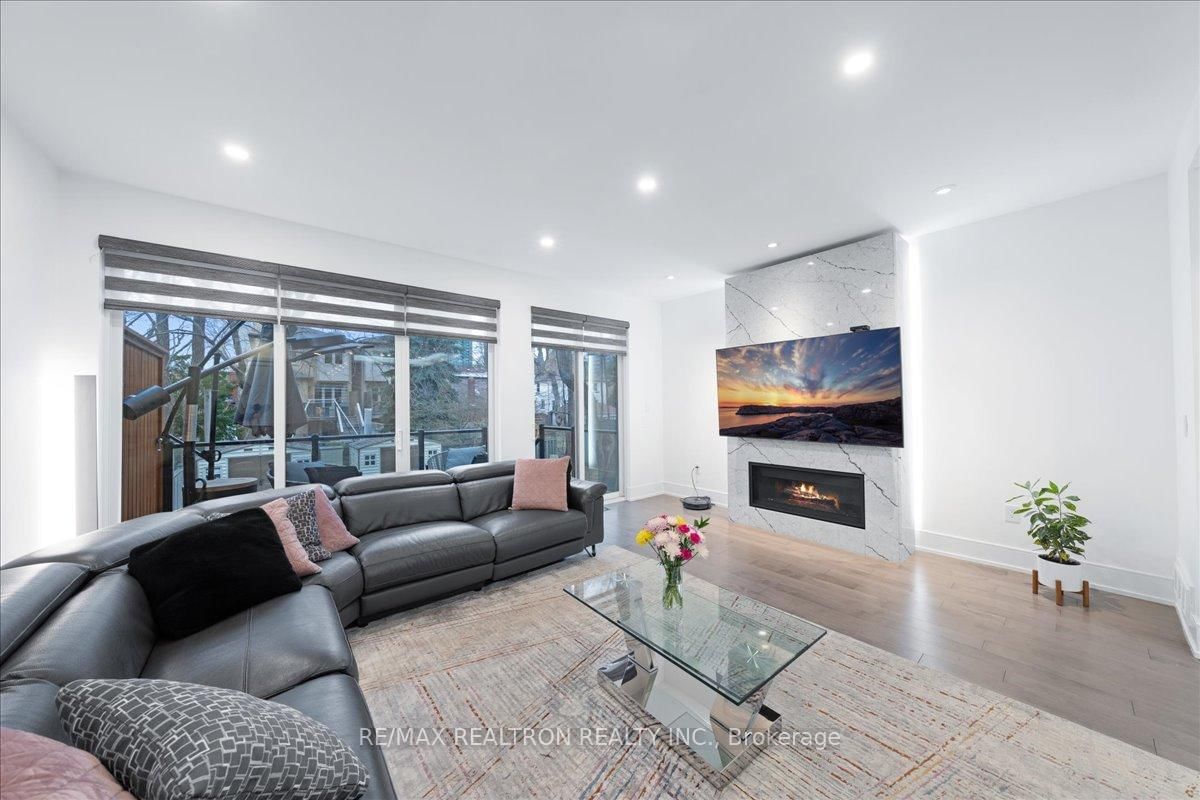
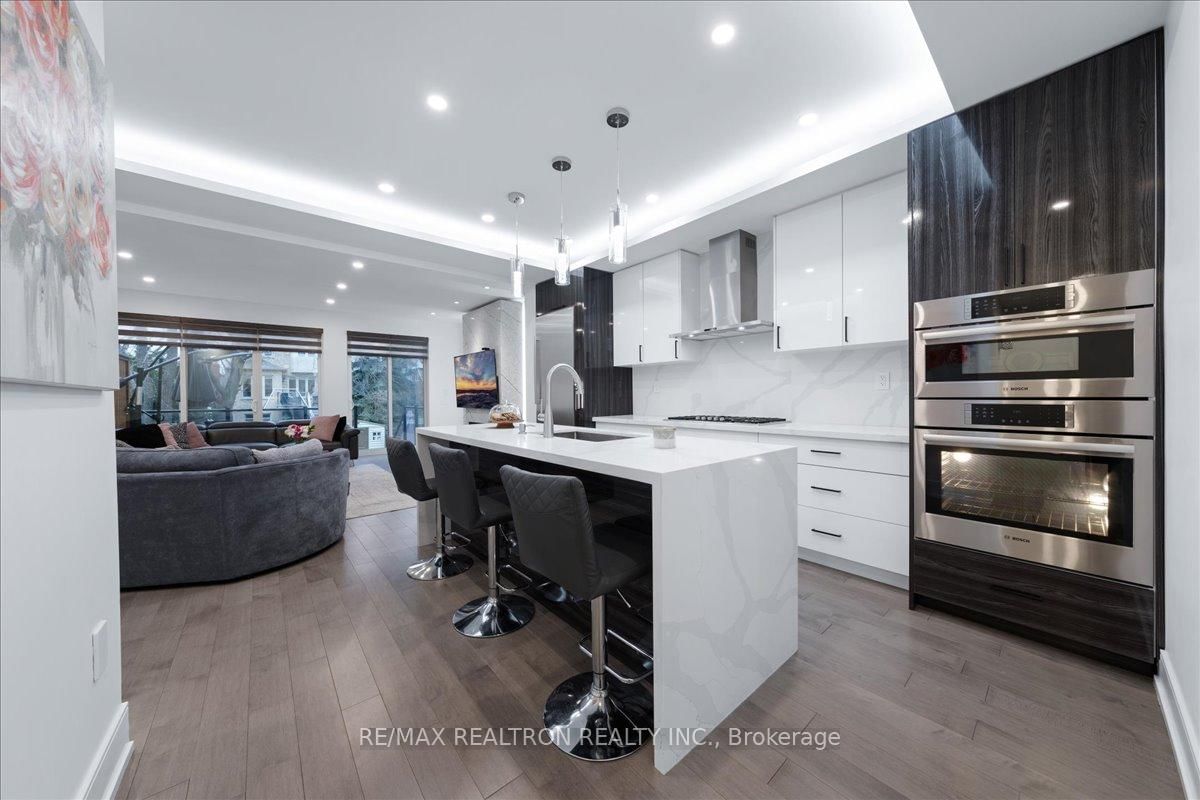
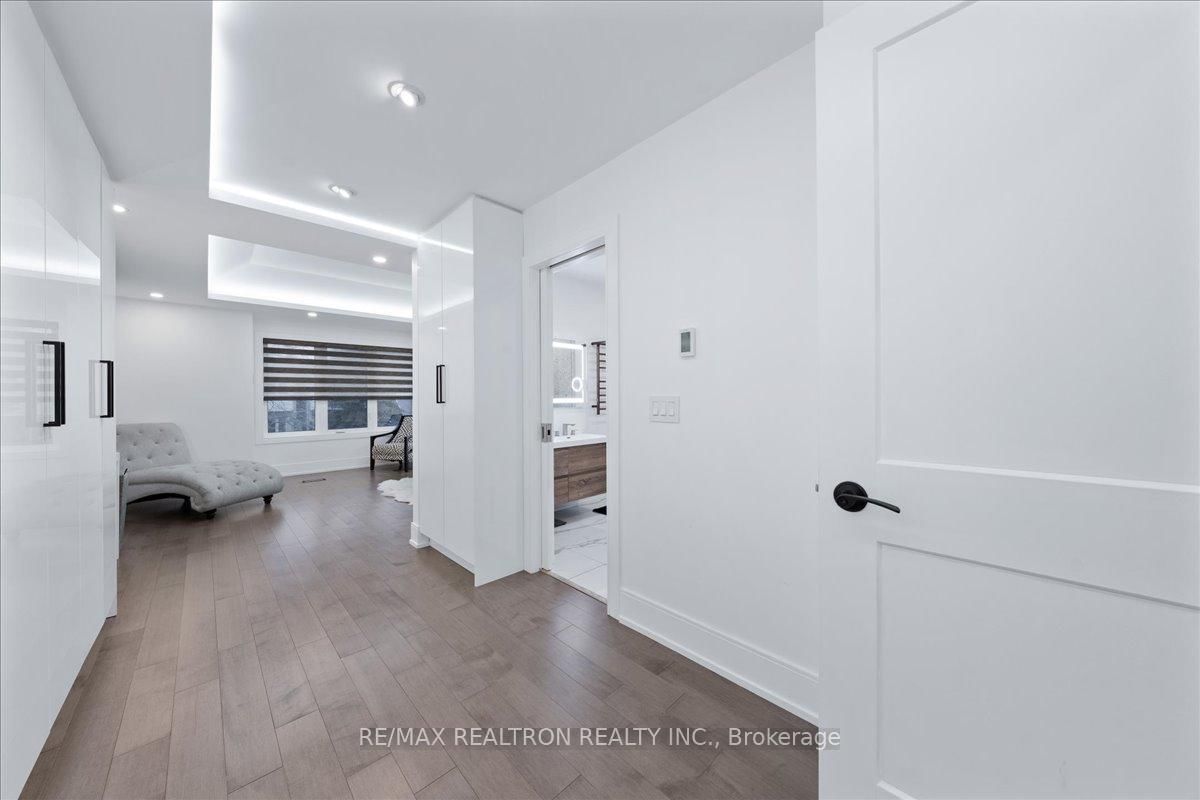
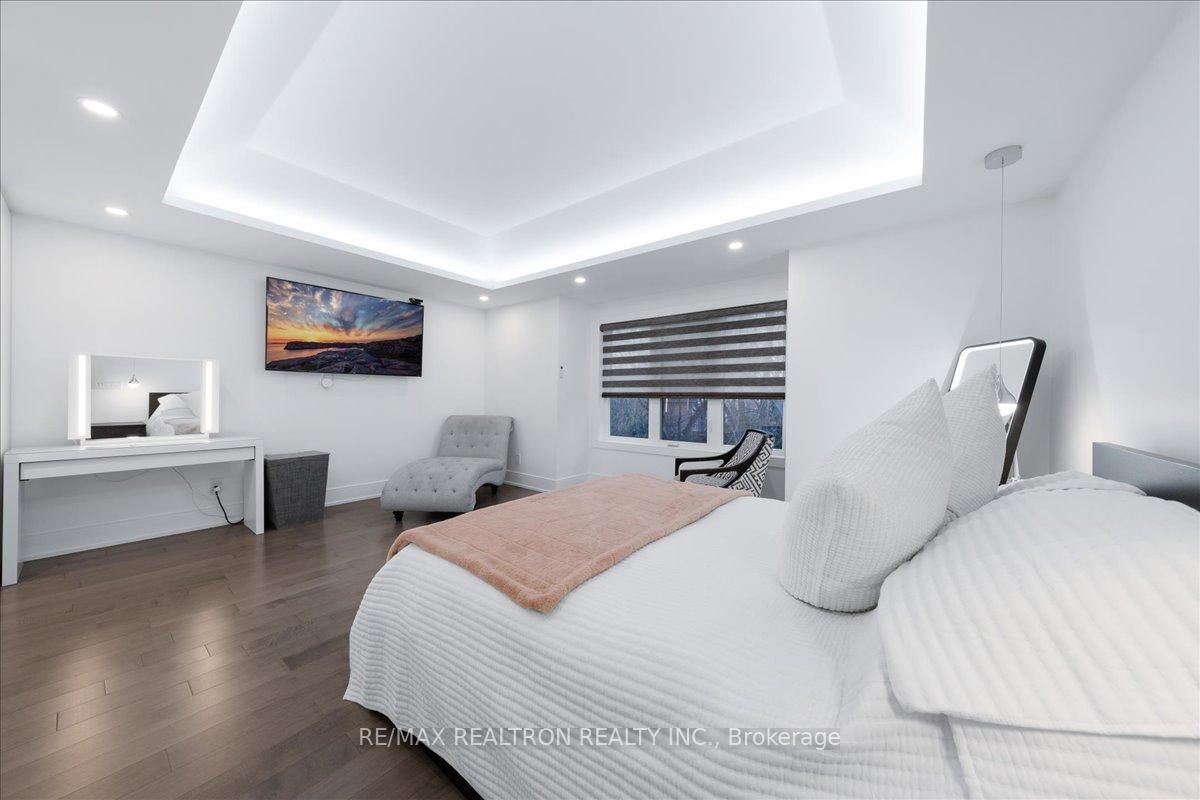
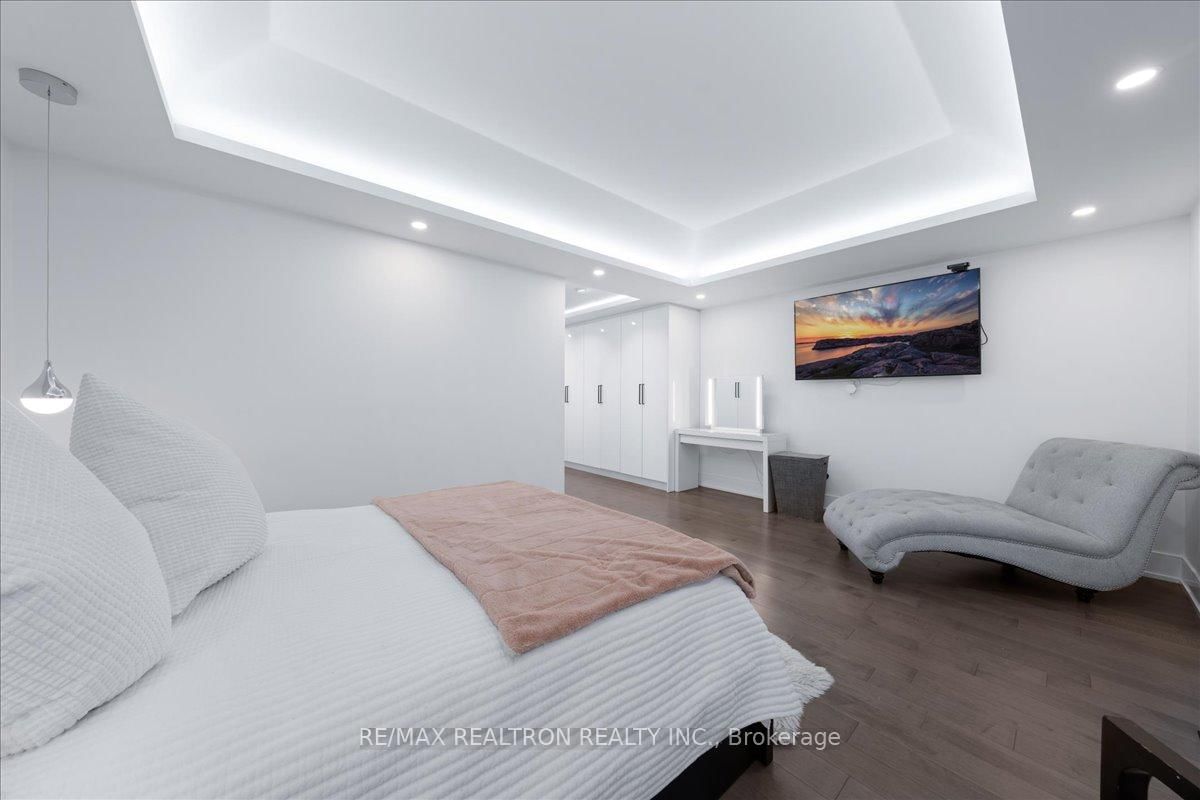
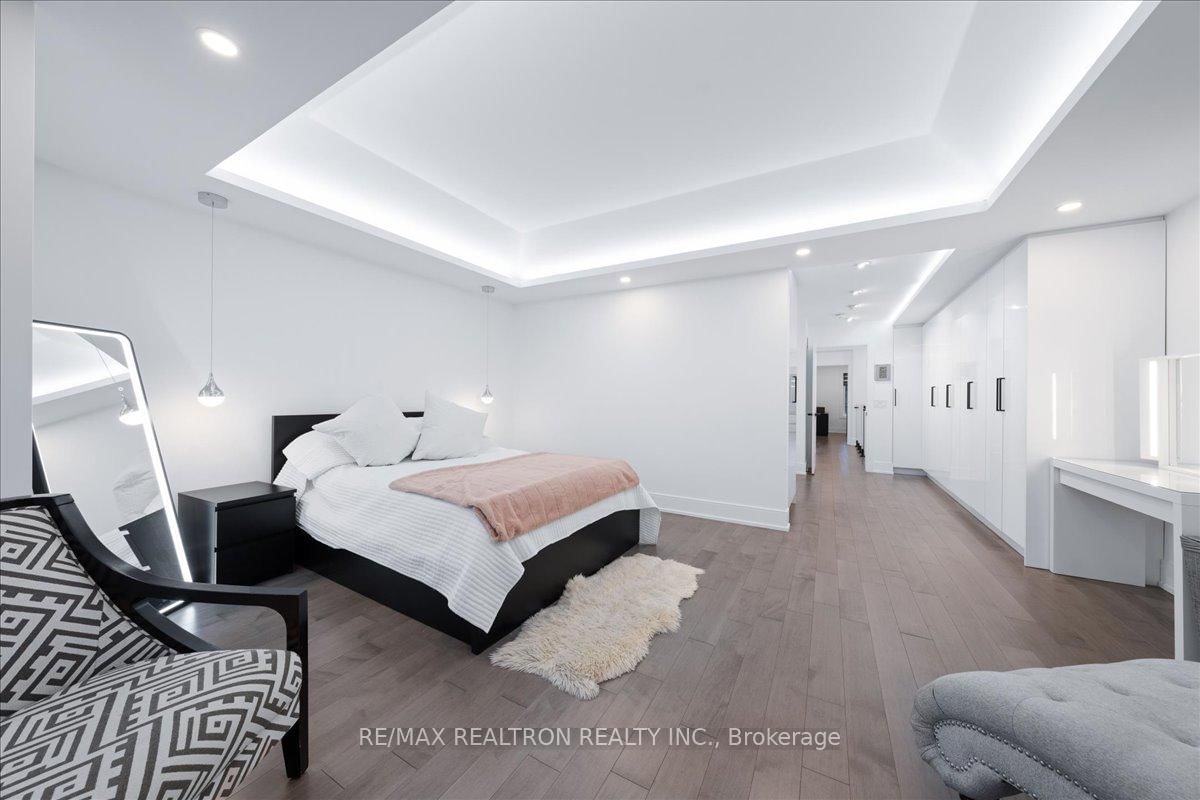
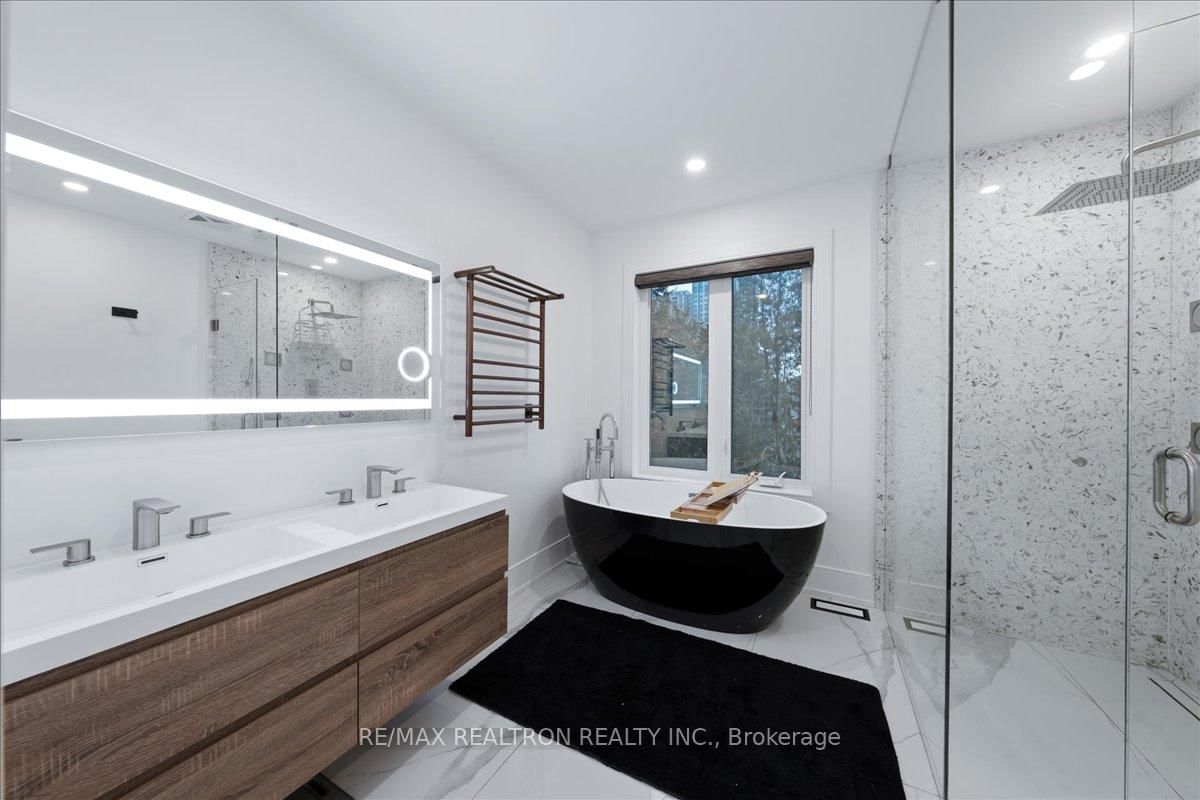
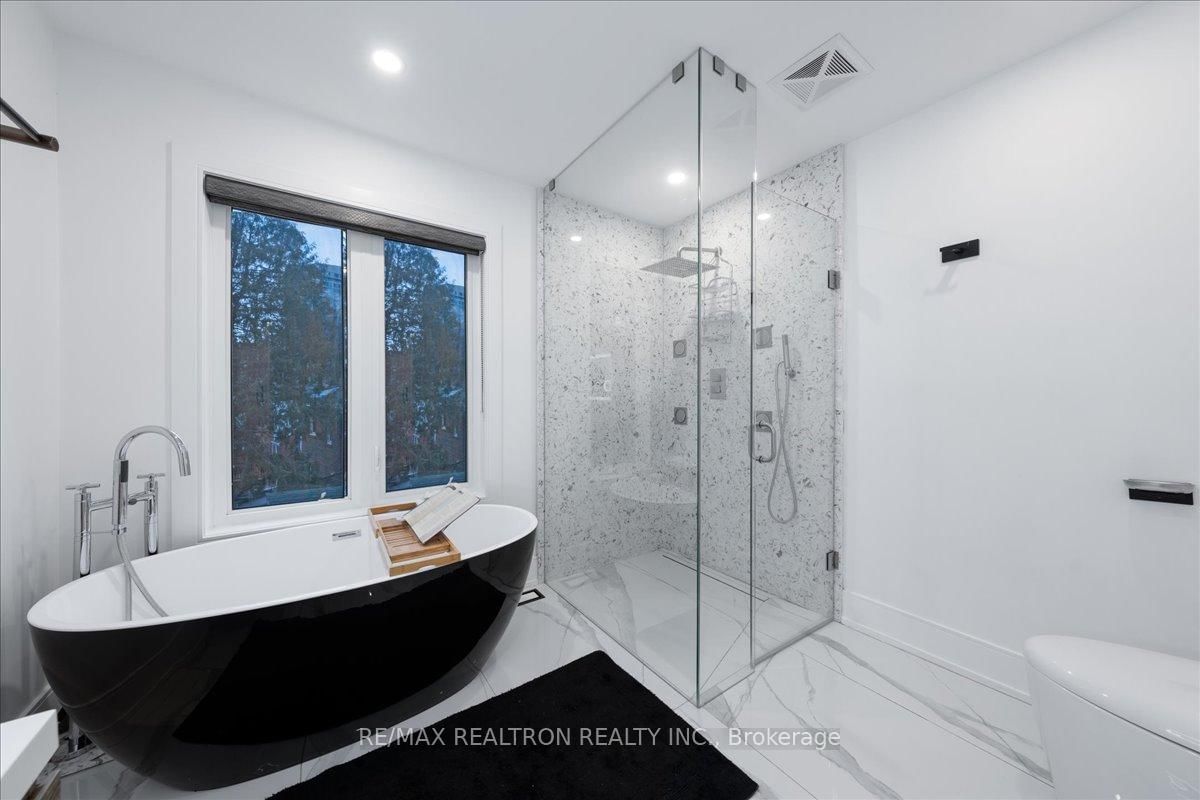
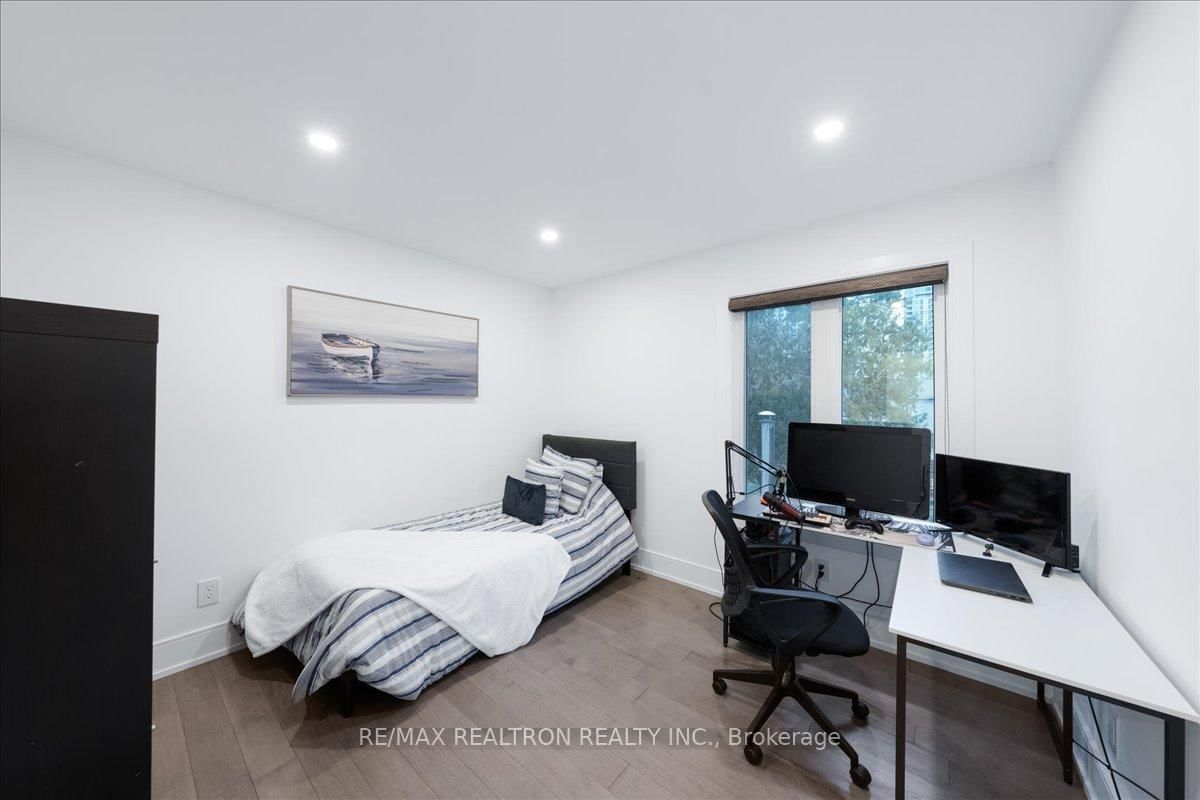
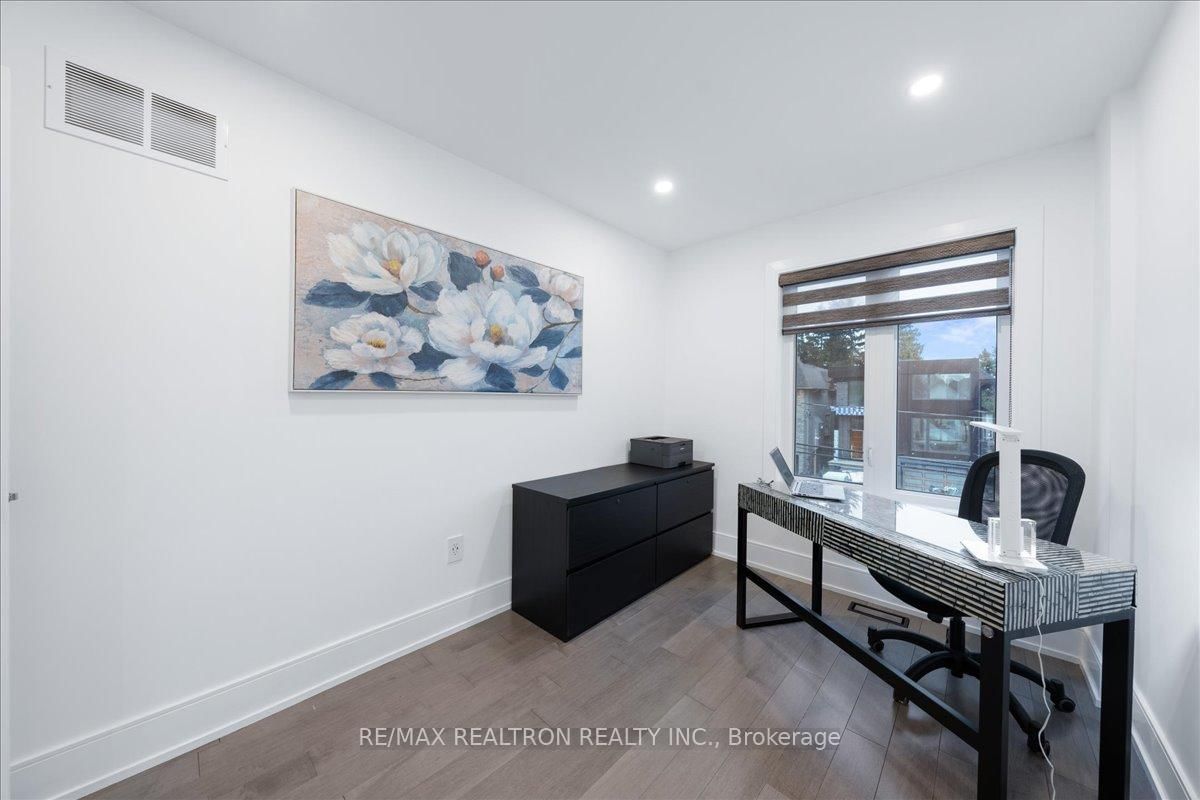
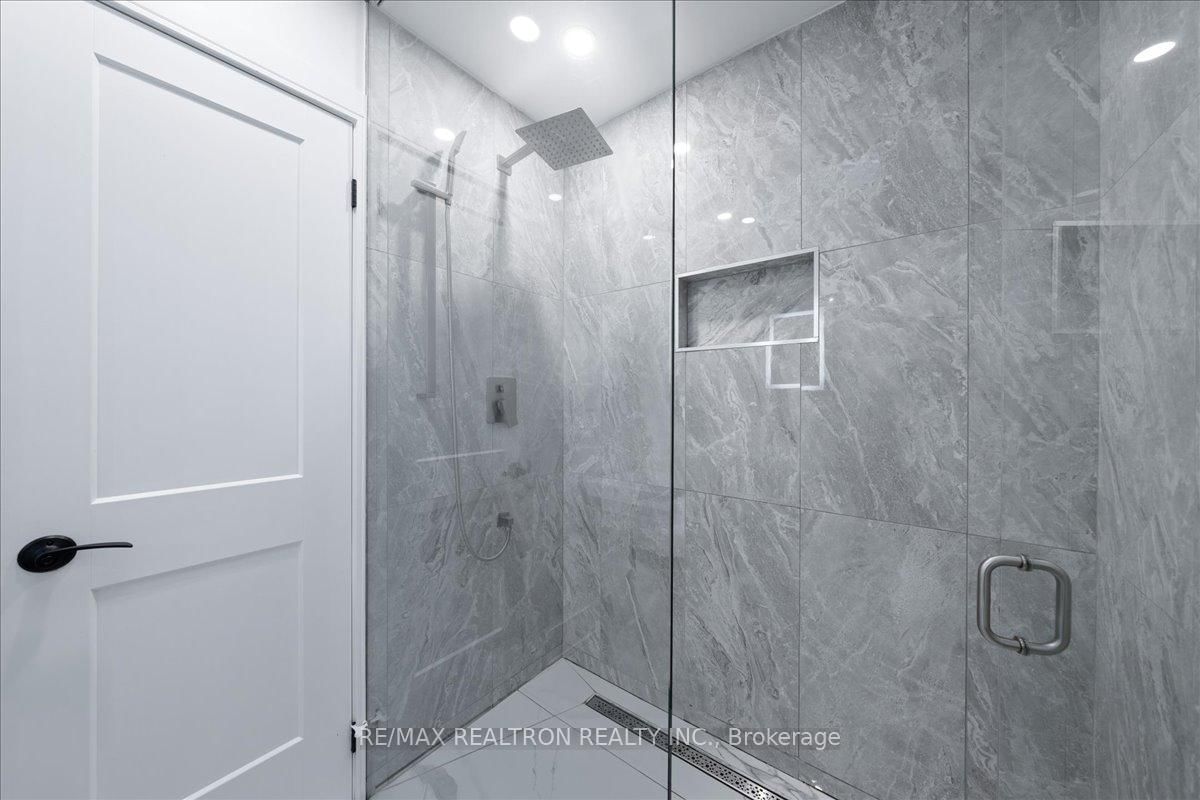
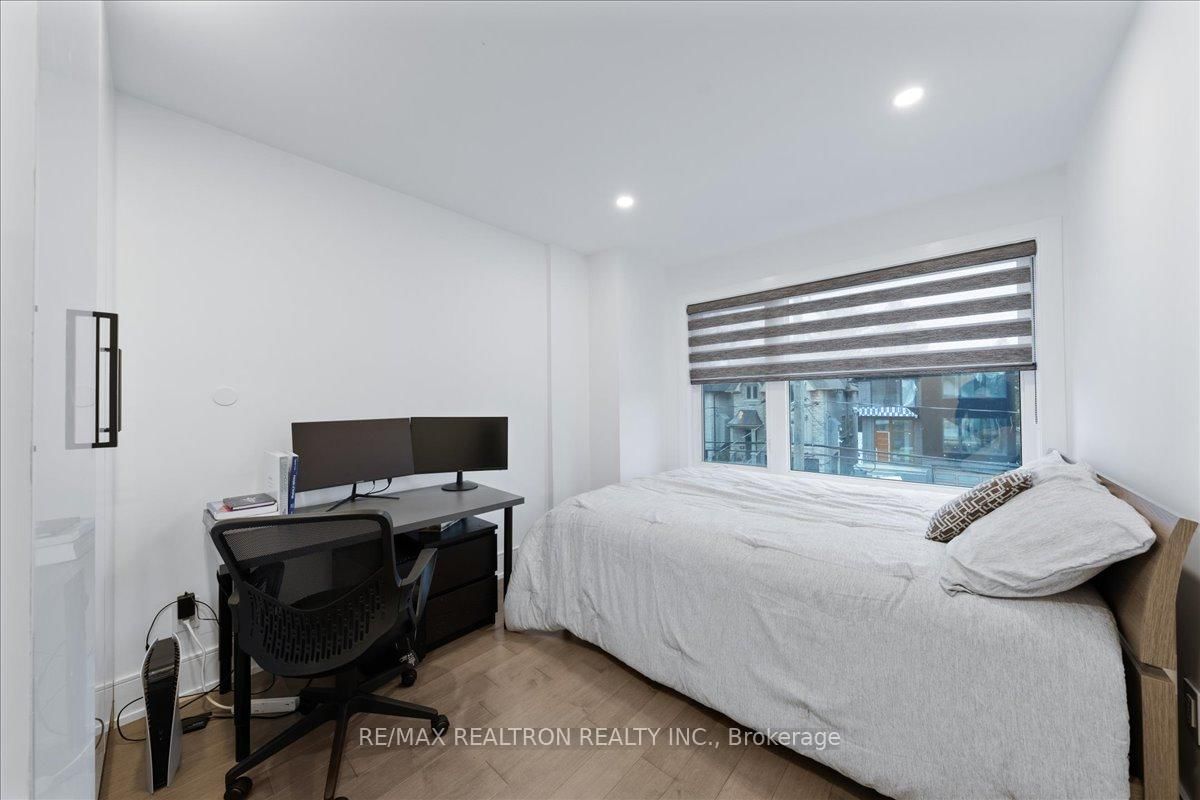
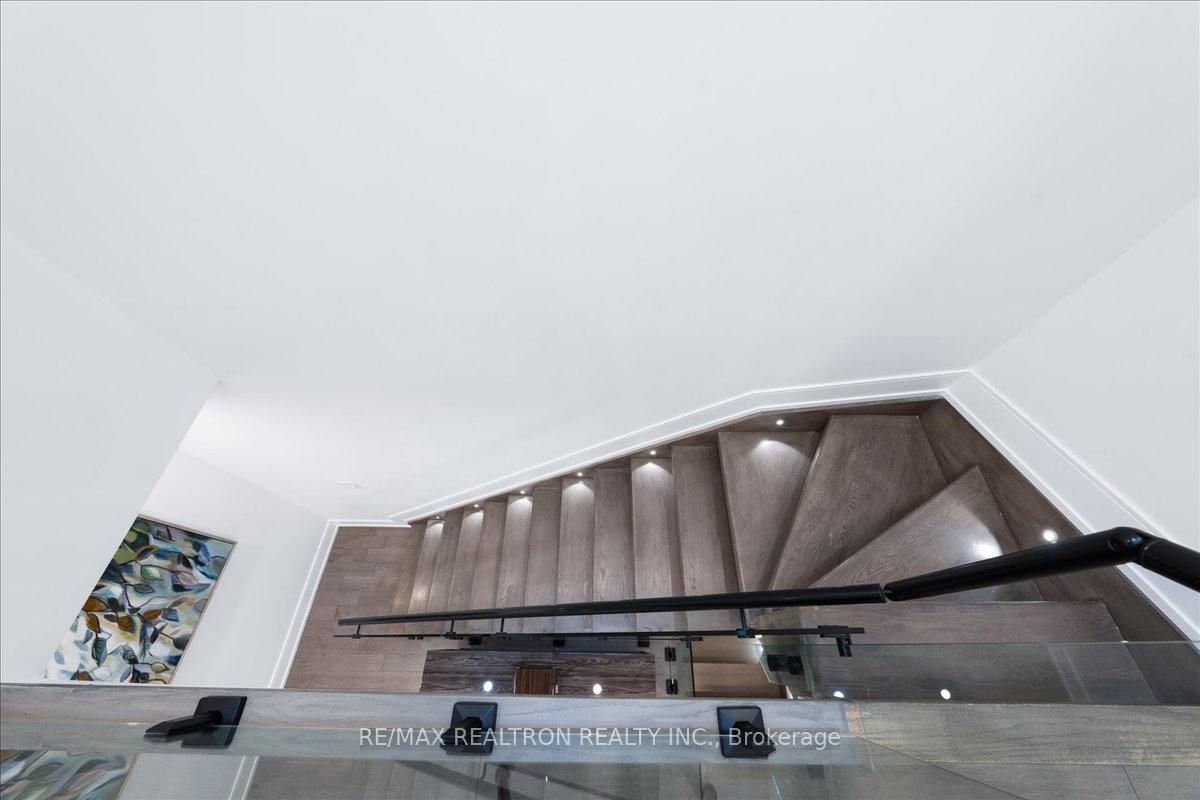
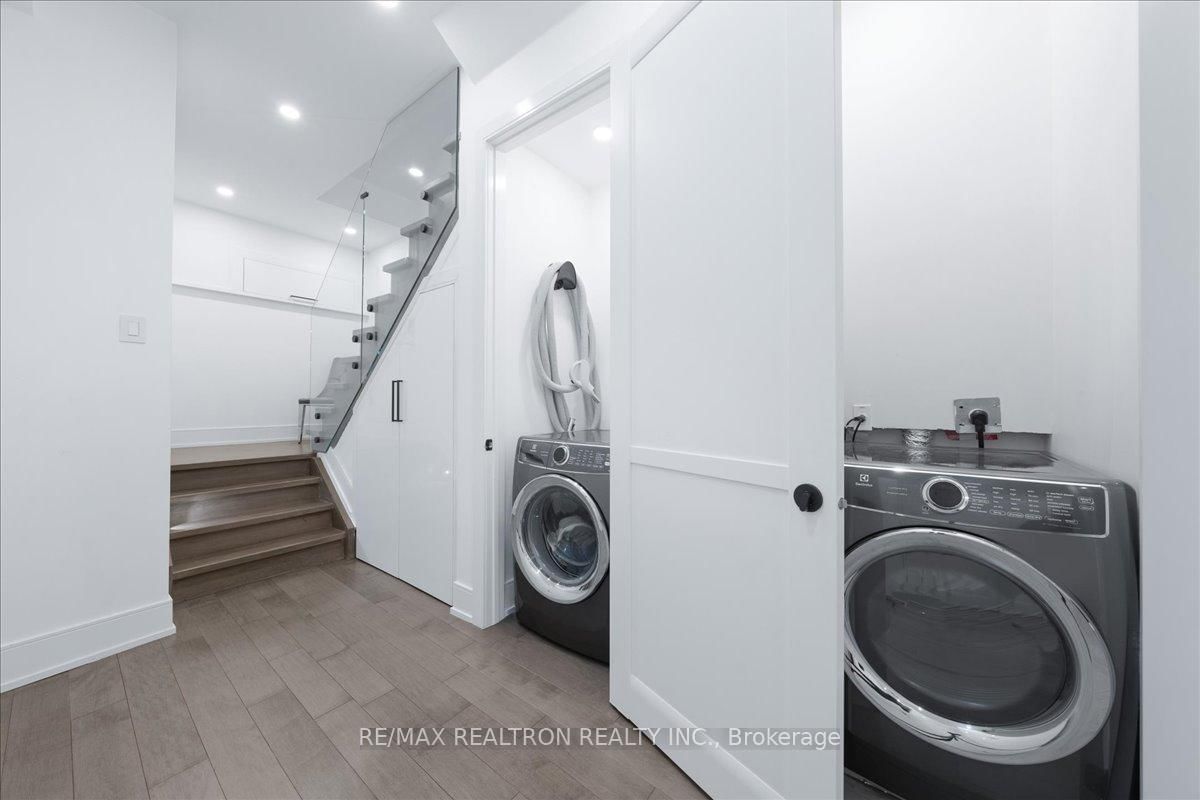
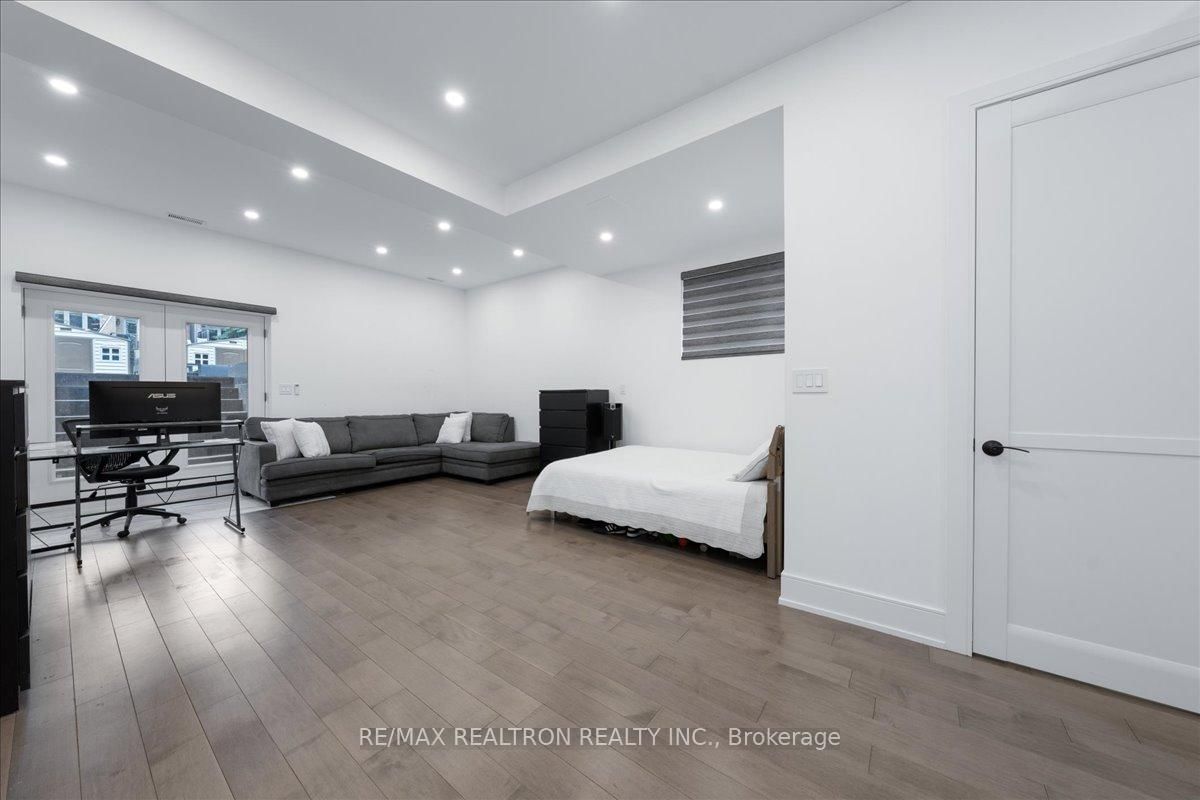
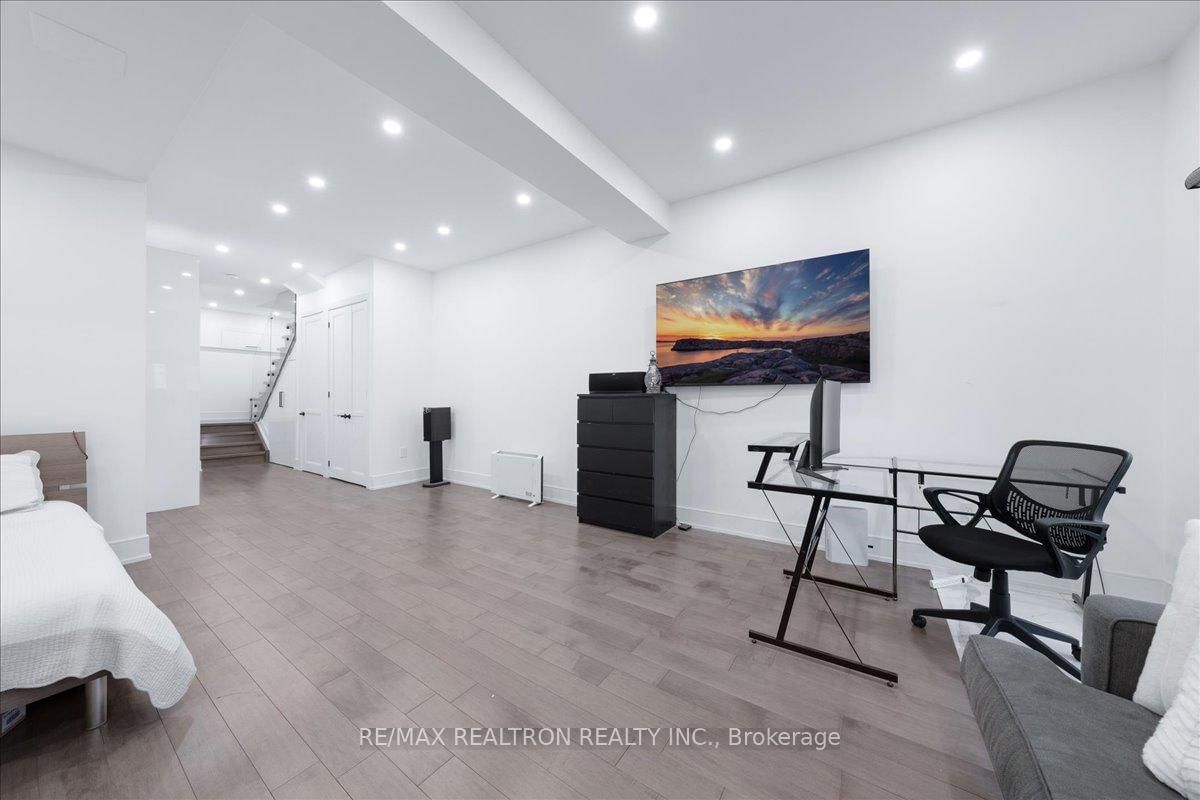
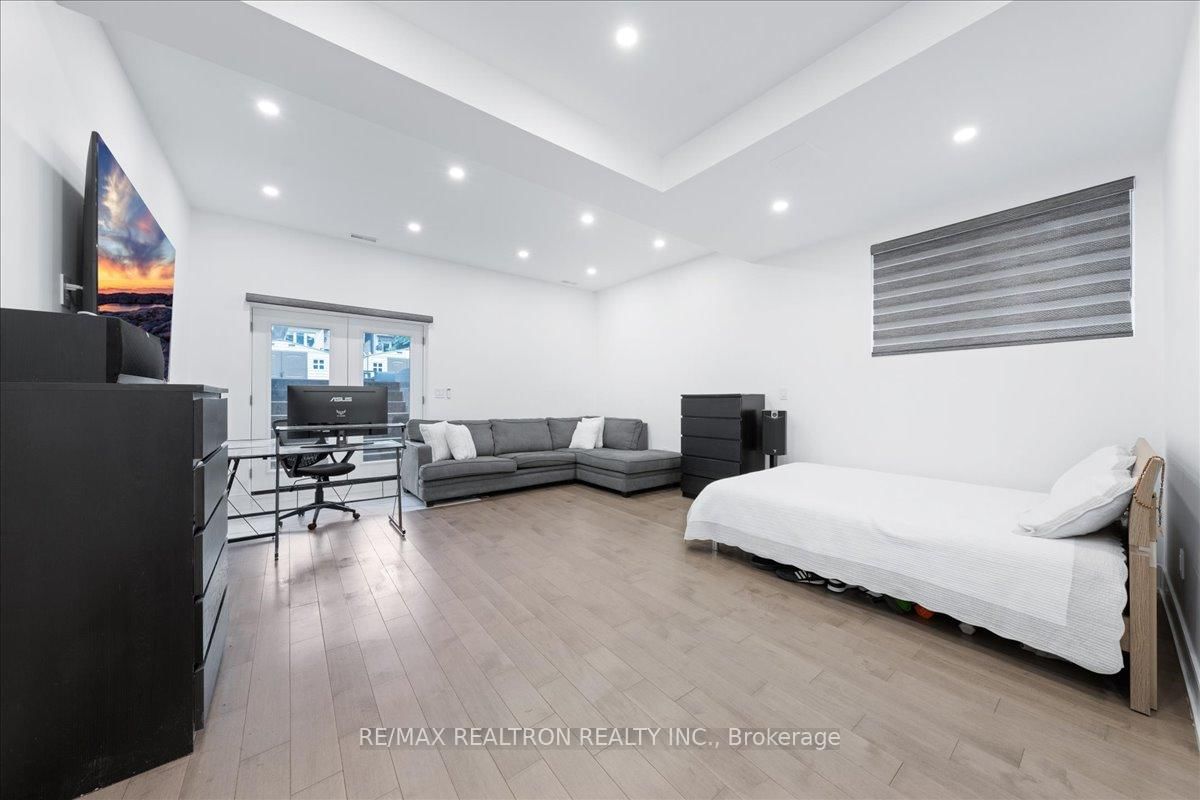
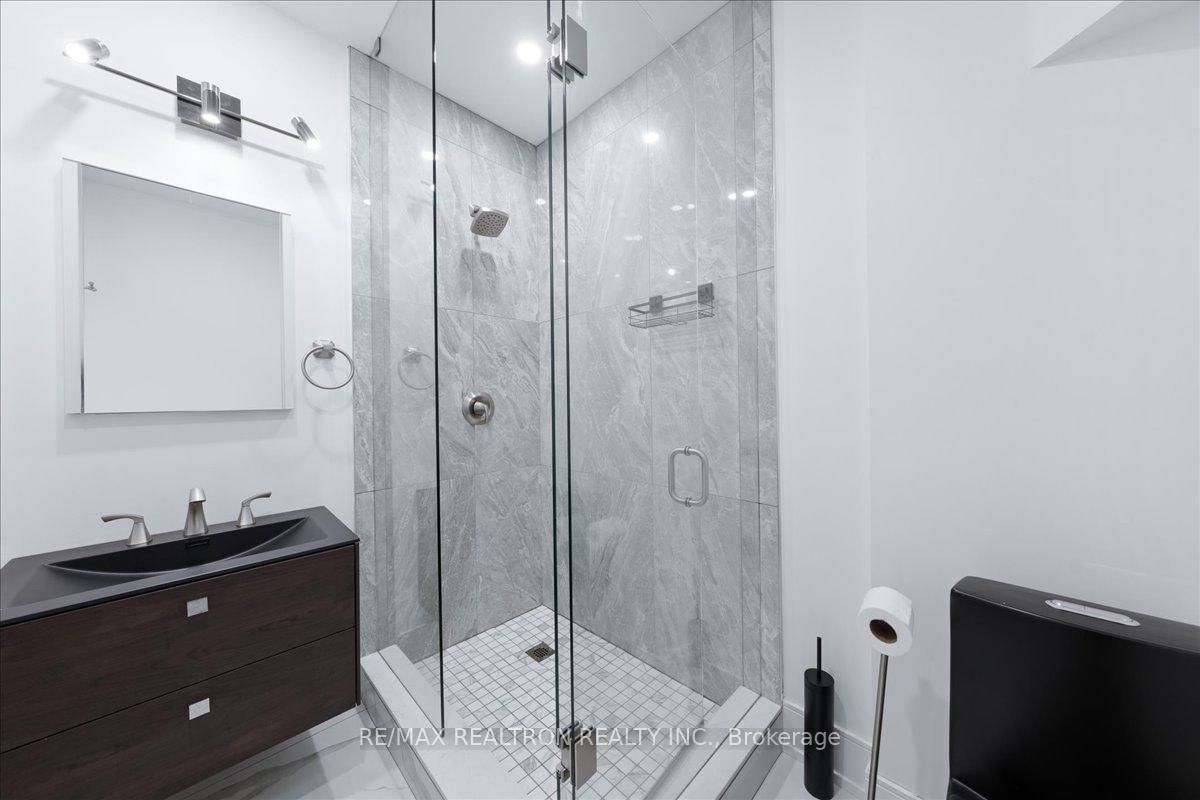
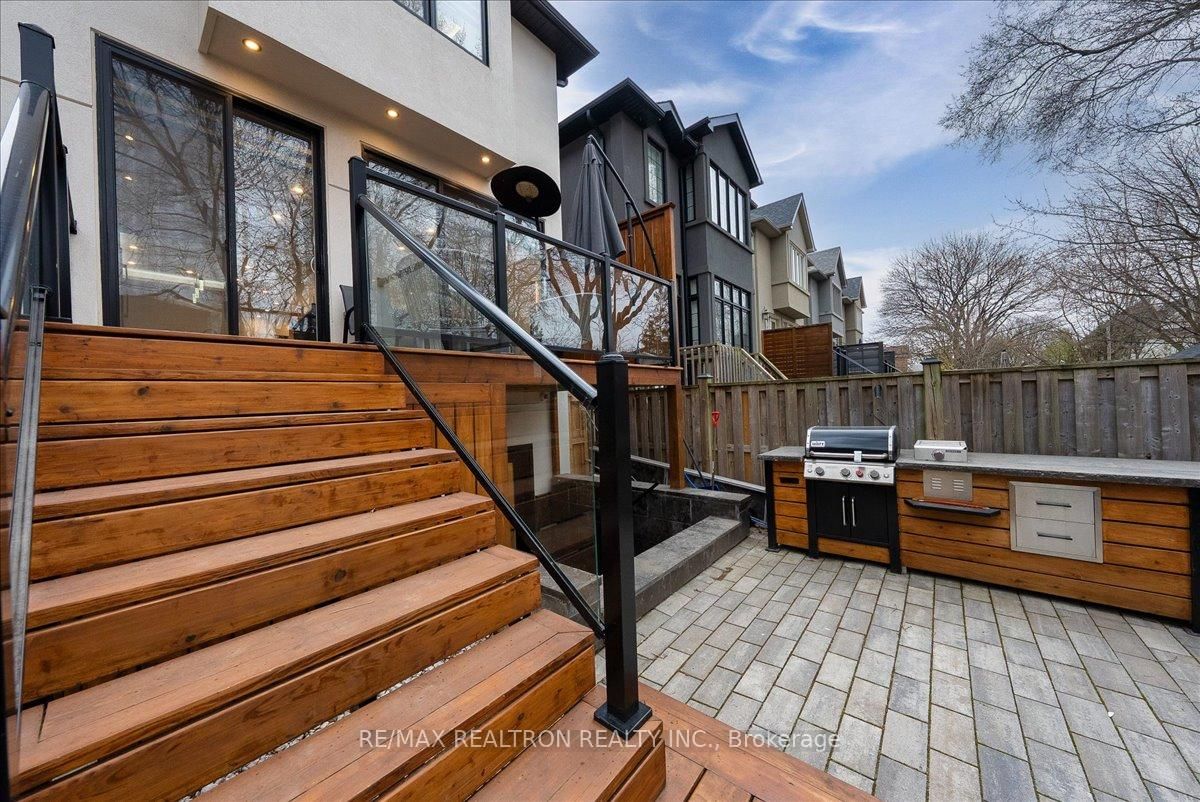
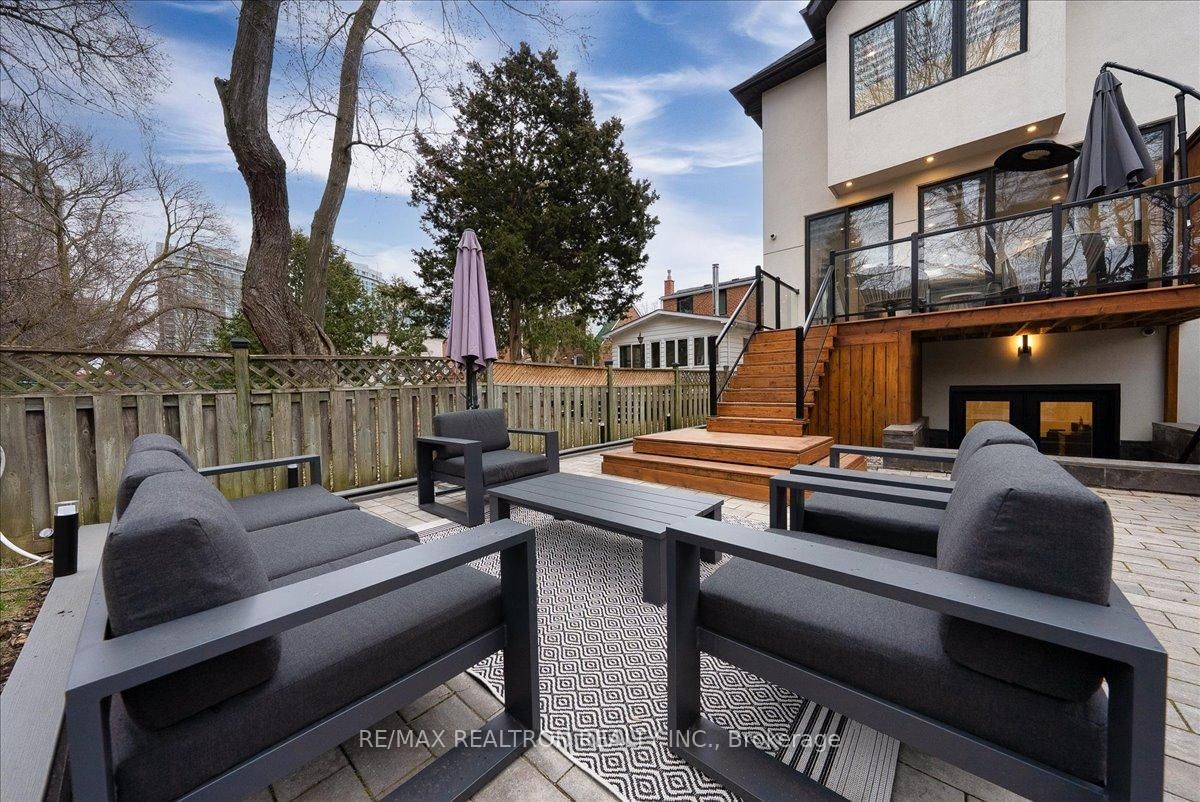
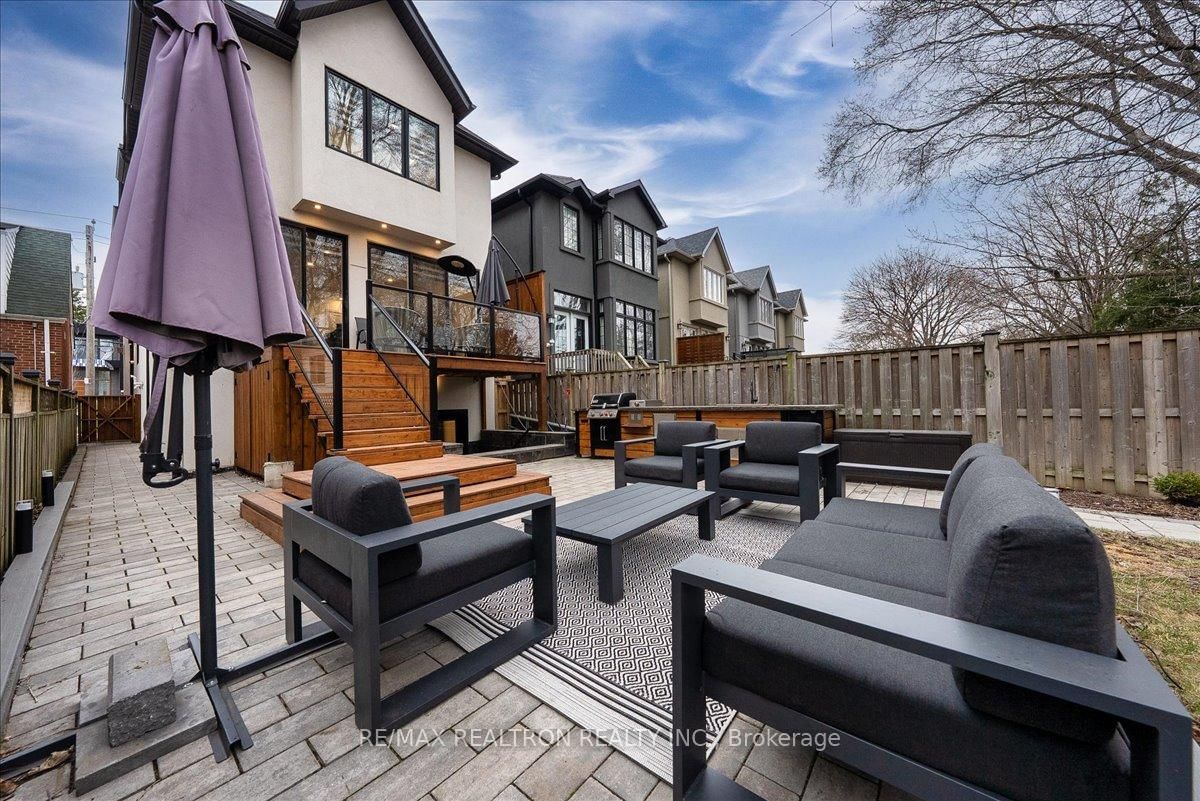
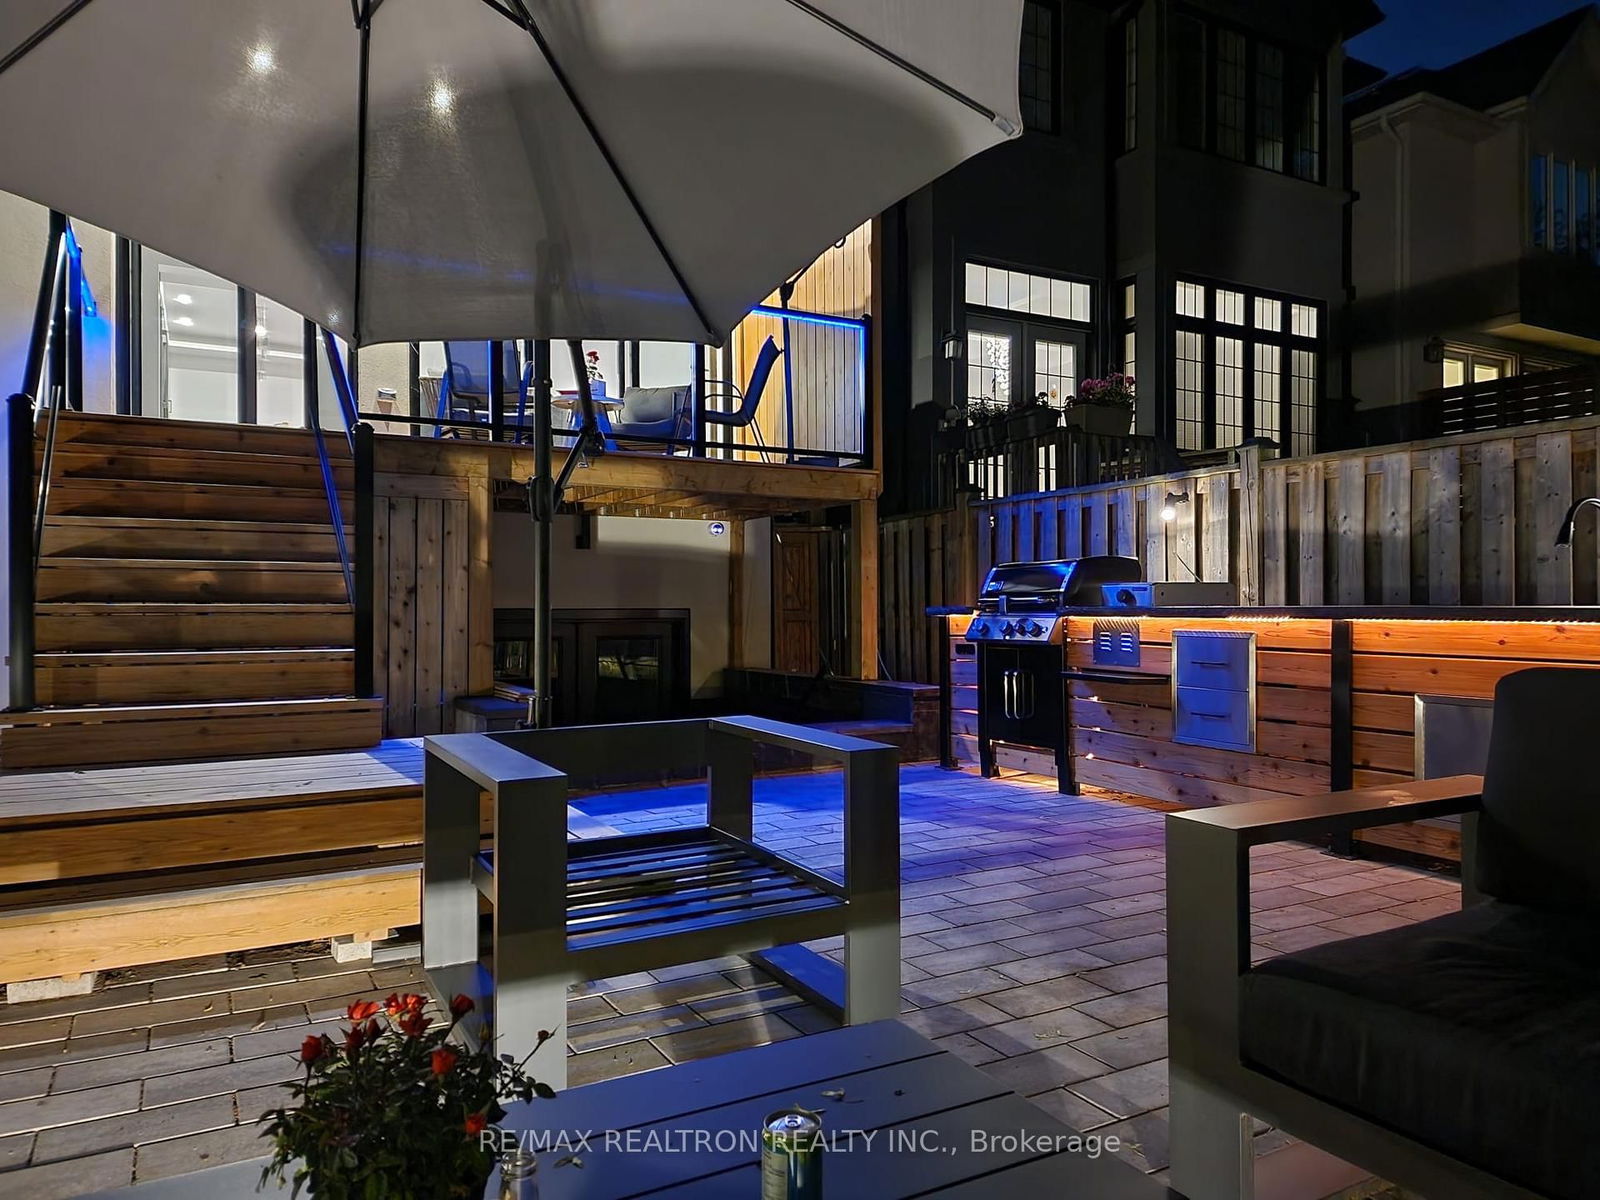
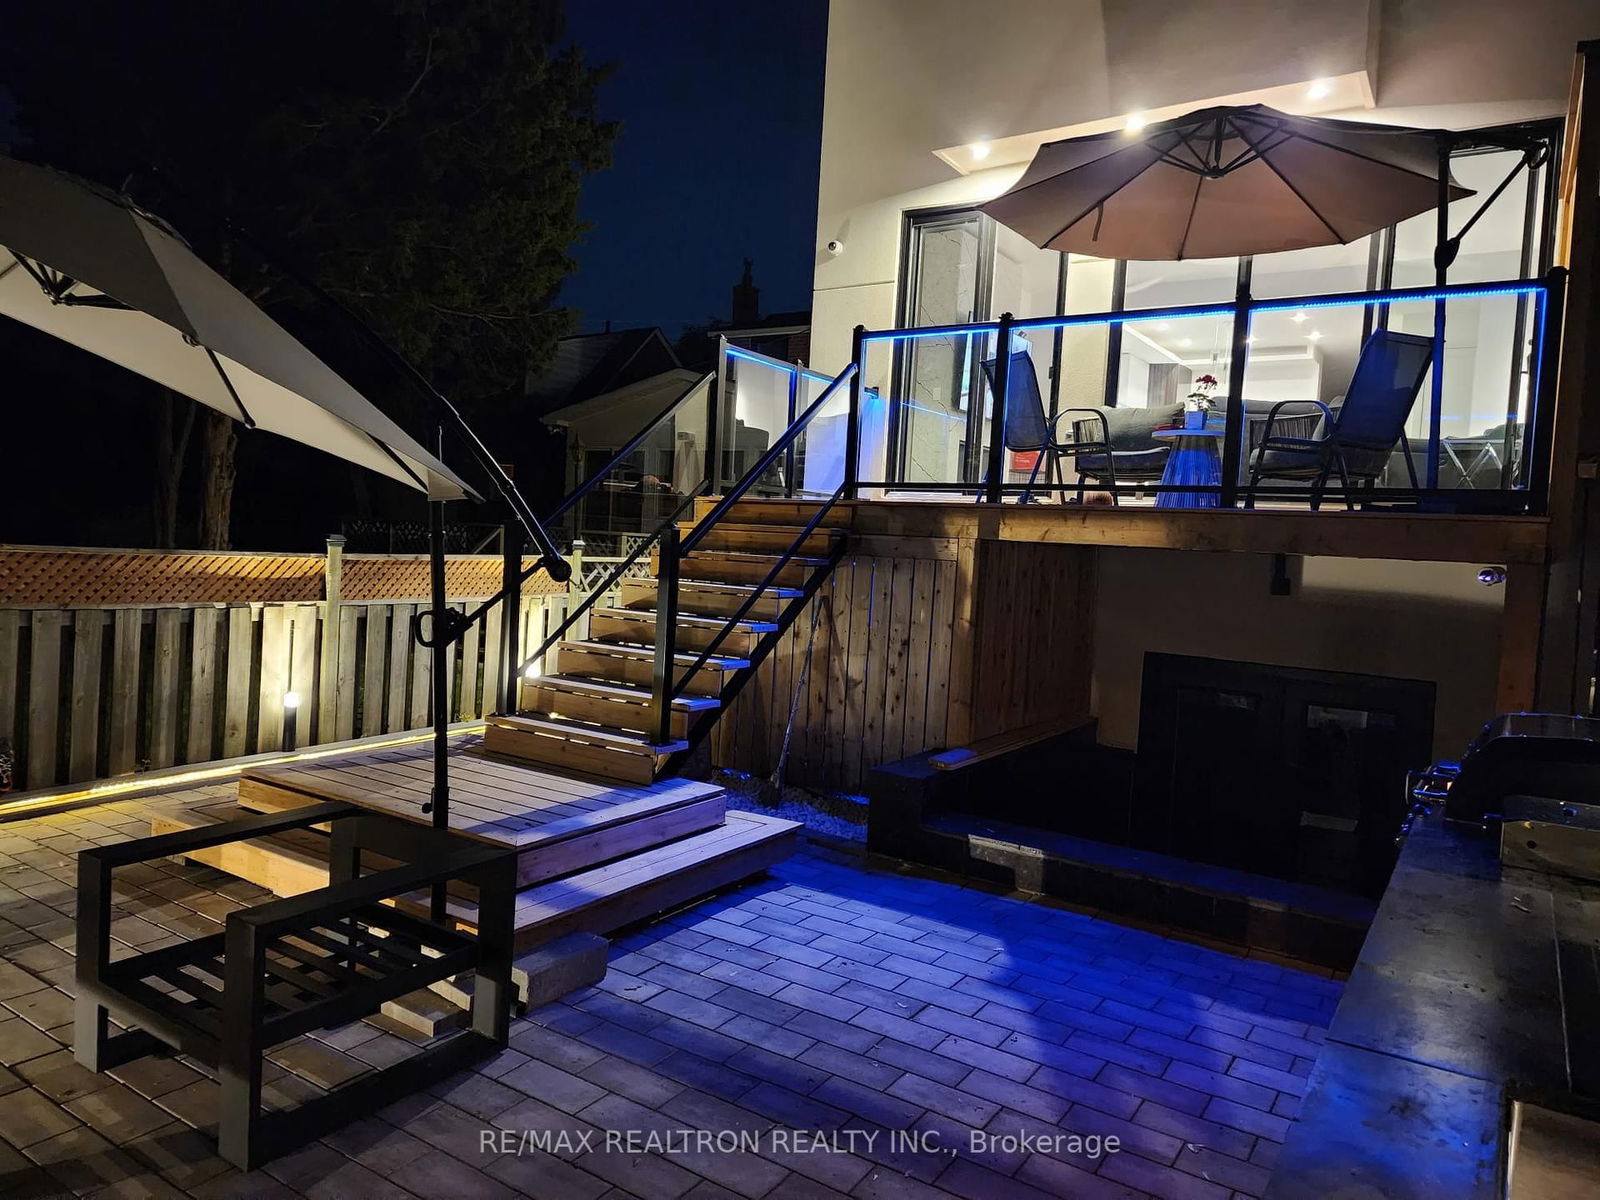
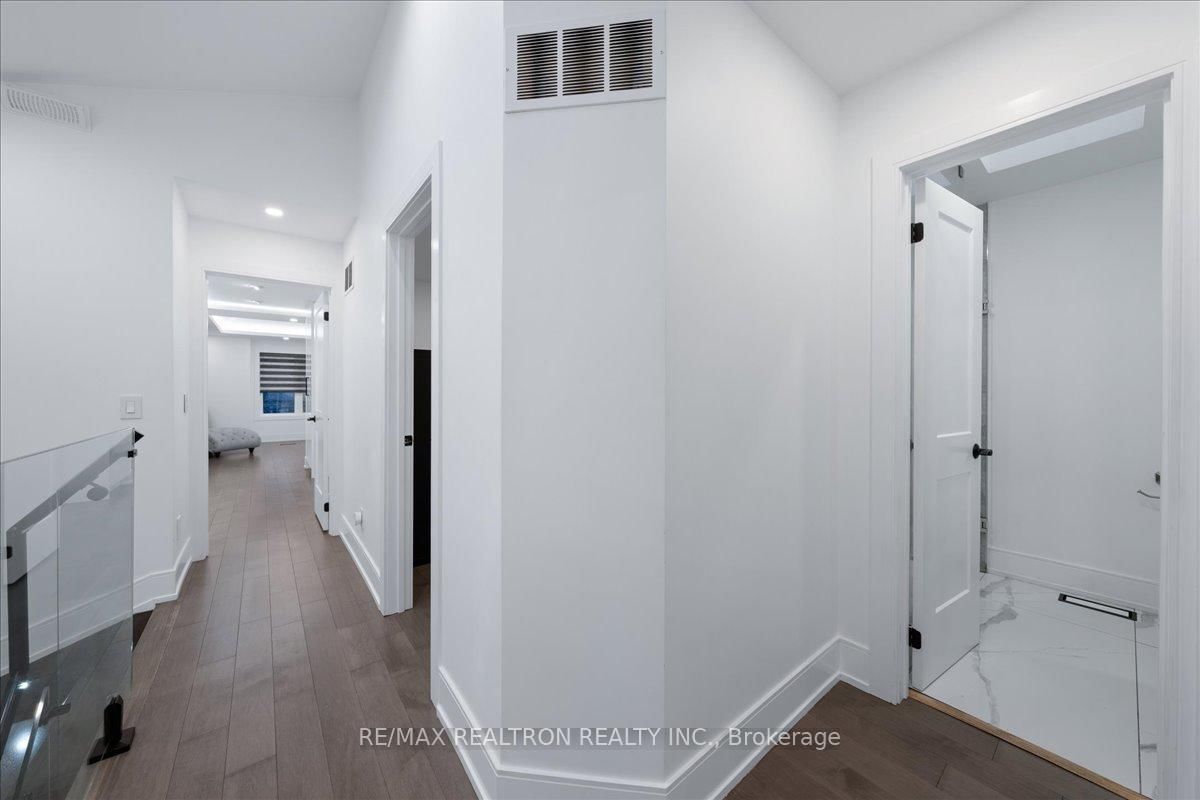
**Experience luxury living -A custom-built home completed in 2021**This home is for a Buyer who is seeking a luxurious lifestyle in an affordable price) ----situated In the Heart of North York Walking distance to Yonge/Sheppard Subway station/longe shopping/Gwendolen Park/Hwy 401) **This exquisite 4-bedroom detached house boasts a contemporary interior & open concept floor plan w/hi ceiling(main 9ft--basement 10ft--feels like a ground level (back) ---modern kitchen with 36 inch Thermador gas cooktop and Thermador rage-hood w/a spacious breakfast area, perfect for hosting gatherings and creating culinary experience---well-proportioned/comfy family room----STUNNING lower level finished walkout basement---Revel in the spaciousness of 9-foot ceilings on the main and 10-foot on basement (HEATED BASEMENT) levels, offering an airy and expansive atmosphere throughout the home---**Spanning Apr 2,500 square feet of spectacular living space, Custom outdoor kitchen with Weber cooktop, wifi controlled BBQ sink and fridge make your backyard luxury and welcoming for your summer back yard party with premium wifi controlled outdoor lighting. This home offering you programable wifi controlled interior lighting package, wifi security camera, ensuite heated maser ensuite floor, heated towel rack, 4jet body spray with rain shower head, single slab shower walls, heated auto bidet smart toilet with charcoal filter. **EXTRAS** Fridge, Gas Stove , Dishwasher, Microwave, Front-Load Washer/Dryer, 1 Gas Fireplaces, Central Vacuum. Automated spotlight and window screens that ability to control on apps.
Living
Dining
Kitchen
Primary
2nd Br
3rd Br
4th Br
Bathroom
Bathroom
The graph below compares the average list price and average sale price of homes in this neighborhood by month for the last 24 months. When average sale price is greater than average list price, this may suggest a buyer's market. When average sale price is lower than the average list price this may suggest a seller's market.
The graph below illustrates the average days on market for homes in this neighborhood. The yellow area may indicate a buyer's market, the green area may indicate a balanced market and the red area may indicate a seller's market.
Sales Representative, Century 21 People’s Choice Realty Inc., Brokerage
(647) 576 - 2100
Toronto, St. Andrew-Windfields, M2P 1R5
Toronto, Bedford Park-Nortown, M5M 3G4
Toronto, St. Andrew-Windfields, M2P 1J2
Toronto, Willowdale West, M2R 1A4